What are the metrics you need to focus on when doing off-site ads on Facebook?
Note.
Click on the top to topHugo.com, don't be across the border e-commerce big and small things
How's your Facebook ad? Want to know which metrics should be tracked? In this article, you'll analyze and evaluate the performance of your Facebook ad campaign in eight ways.
Assess user awareness
When you're advertising on social media, it's important to know how many people are viewing your content. You can measure this by looking at two key performance indicators:
Reach: That is, the number of people who view the content of the ad, if your ad is shown to 100 users, your reach will be 100;
Exposure: The number of times people view your ad content, even if the same person viewed the ad multiple times. If your ad is shown to 100 people and each person looks at it twice, there are 200 exposures.
The importance of these metrics depends on the type of ad campaign and the goal. For example, ads optimized for link clicks don't necessarily need to measure user awareness, but ads that are optimized for user awareness need to be measured.
What Facebook ads need to be reviewed frequently is the ratio of exposure to reach. If the reach is 1000 and your ad content gets 10,000 hits, everyone in your audience will see your ad an average of 10 times. Showing people the same ad multiple times can cause ad fatigue, forcing them to click on hidden ads and mark them as duplicates. In turn, your ad relevance score will drop and lead to higher CPC and CPM.
In short, your entire ad campaign will become more expensive because the algorithm thinks your ads are irrelevant, so you'll pay more to reach these viewers.
Assess engagement
Engagement refers to metrics that people interact with ad posts, such as:
· Likes (likes)
· Shares (Share)
Comments
Click
The importance of these metrics will vary depending on the type of ad campaign. For example, an ad campaign optimized for conversion should focus more on financial metrics, while an ad campaign optimized for reach should prioritize engagement KPIs. Because likes and shares can increase the natural reach of your ad posts. High engagement sends a signal to social advertising algorithms that your content is engaging and gives these platforms reason to show ads to your audience.

Remember, social media platforms want to make sure users have a great experience on their sites. Showing low-quality ads doesn't do that, but ads with high engagement rates are more likely to meet the requirements of a "good experience."
Monitor click-through rates
The click-through rate for social media ad campaigns is the percentage of people who click on a link after reading an ad. As a reference, The average click-through rate for Facebook ads is 0.9 percent, while the average click-through rate for Twitter and LinkedIn ads is 1.51 percent and 0.26 percent, respectively.
Click-through rates for paid social ad campaigns are important because they are an important measure of ad quality. The more people browse your ads and click on links, the more relevant and engaging your ads become. In addition, high click-through rates can often help you save money on paid advertising campaigns for exposure.
Suppose you start an ad campaign that pays $1 per click and gets 30 clicks from 1,000 exposures, the total cost of the entire ad campaign is $30. But when you pay $20 for every 1,000 exposures and achieve a click-through rate of up to 5%, you get 50 clicks. Not only do you pay less for 50 clicks, but you can also get more ad engagement with less marketing costs.
Click-through rate split test
You can run A/B tests on Facebook paid ad campaigns to determine how to improve click-through rates. This option in Facebook Ads Manager edits parts of your ad campaign, such as titles, text, or visuals, to determine which variant will get better click-through rates.
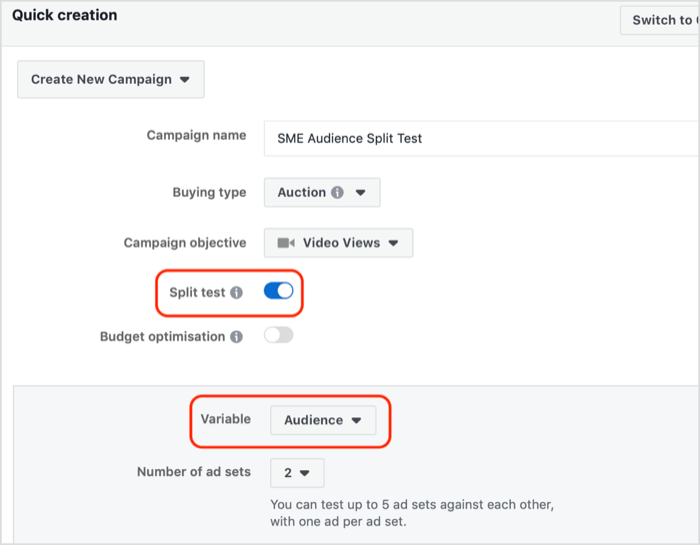
Throughout the process, it is important that your split test is statistically significant. To calculate this statistical significantness, you can start with assumptions. For example, including the word "free" may increase the click-through rate of your ad. In addition, create an alternative assumption that is contrary to the forecast results. For example, using "free" once does not affect the click-through rate of your ad. Once you have two assumptions, assign a value to determine the success of your test, which is called a probability value. If your results fall below this threshold, the initial assumption is correct.
The final step is to check the results (a statistical method for detecting differences between theoretical and observational values) and find out how they compare to probability values.
Track the number of recommendations from social media
Tracking website traffic is important to marketers. But when you're advertising on social media, you need to start delving into your site analysis from the number of recommendations you get from each channel.
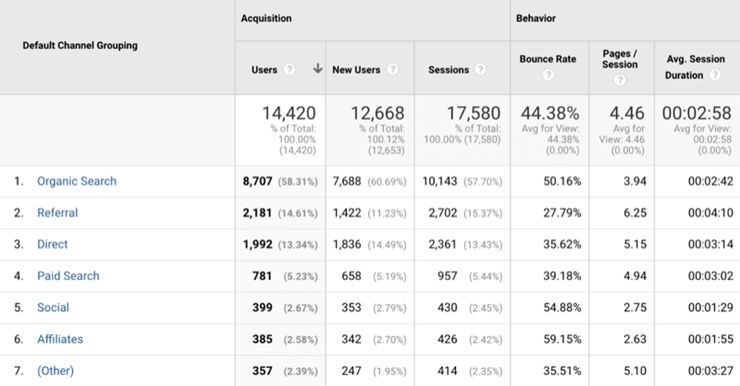
Sometimes, social media ads or posts have different clicks than the number of people actually visiting the site.
Suppose you're promoting a post on Facebook, someone clicks on a link in an ad, but exits the browser tab as soon as they click. Facebook thought it was a click. However, your site analysis did not start because the page did not load. These differences may mean that your ad platform shows more traffic than you actually get. However, in Google Analytics, verifying the number of recommendations received from each social media channel is a good way, especially if you're using UTM parameters for finer tracking.
Check the bounce rate
After reviewing the analysis, you may find that you have received some traffic from social media channels. Now you need to think about what happens when people click to visit a website. Whether they spend time browsing your site and interacting with others, or whether they click the exit button after staying on the site for a few seconds. If it's the latter, your bounce rate will be high.
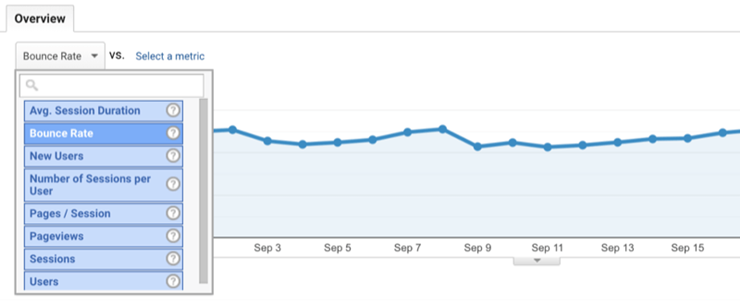
Tracking your bounce rate lets you know what type of content you should share on social media. Suppose you have a 10% bounce rate for your blog post How to Create an App and a 90% bounce rate for The Technical Guide to Creating an App Integration. Significant differences may indicate that your target users may be more interested in entry-level content.
However, high bounce rates can also affect the entire marketing team, as they can have a knock-on effect on SEO, where Google believes that short site stays may be associated with low-quality content.
Pay attention to conversion rates
Ask what's important in any social media marketer's ad campaign, and conversion rates may be the more common answer, in simple terms, the percentage of site visitors who become paying customers. No matter what type of activity you launch, your goal is to get more conversion rates. In the long run, you'll also get more conversion rates from future activities.
You can use a variety of tools to track conversion rates for paid social media campaigns, including:
Your advertising platform
Analysis of your website
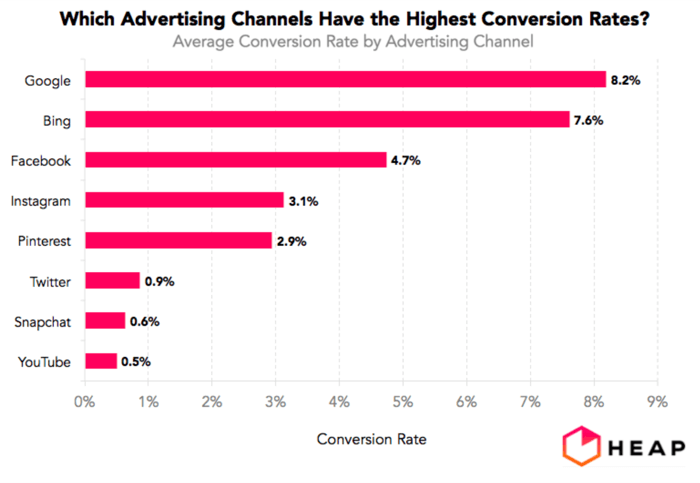
Once you find the conversion rate, you'll know how many visitors from social media have switched to your customers. Facebook's average conversion rate is understood to be about 4.7 percent, surpassing other platforms such as Instagram, Twitter, Pinterest and Snapchat.
Calculate the cost per conversion
Another metric you should keep track of is the cost per conversion, which will help you decide if you can continue advertising on Facebook. More importantly, it can be used to measure whether your investment will pay off. You can calculate the cost of each conversion by divided the total expense by the total number of conversions. If you spend $100 to get five new customers, your conversion cost is $20. For further analysis, calculate the average revenue per user. But if your conversion costs are higher than the average revenue per user, it doesn't make sense to run these ads.
Learn about ROI (ROI)
Facebook's ROI will tell you if your ad spending is paying off. If you spend $100 on ads and generate $250 in sales through these activities, the ROI will be 150%. However, you do not need to calculate this measure manually. Most social advertising platforms have a column that shows the ROI of your activities throughout the process. If your ROI isn't ideal, it means you're investing money in an unsustainable advertising campaign. So you need to rethink your advertising campaign:
·Optimize the ad itself
·Change audience targeting
·Change the activity target

When you make these changes, remember to turn off your ad campaigns so you don't waste more money on underperforming ad campaigns.
When you run an ad campaign, you need to track a series of metrics to learn more about the success of your ad campaign, which you can segment by:
Places to show: Are Facebook ads shown in Newsfeed more interactive than ads shown in the right column?
Devices: Are people using mobile devices easier to convert?
Age and gender: Are click-through rates higher among 18-25 year olds than those over 60?
When: Are people more likely to click on a Facebook link in the morning, afternoon or evening?
If you know which display bits, devices, and demographic conversions are best, you can exclude non-converted elements from future events or split your budget to support better-performing ads.
For example, if you know that women have a higher conversion rate than men, you can spend more of your budget on ads aimed at women. No matter what trends you see, learning more about your ads will help narrow your goals in future campaigns and get better results at a lower cost.
Crazy money-burning ads still don't work well? After measuring your ad metrics, you still can't get started, and go to Hugo.com's Facebook page to teach you your ad delivery strategy and increase ad traffic during the holiday season.
Wen Wen/Hugo.com Song Shu湲
Hugo.com is committed to providing sellers with quality dry goods


Go to "Discovery" - "Take a look" browse "Friends are watching"