2020 Facebook e-commerce ad analysis report

In early 2020, with the outbreak of COVID-19, the global economic downturn has become an inevitable trend. The United Nations estimates that the global economy will contract by about 3.2 per cent by 2020. However, against the backdrop of a global economic downturn in 2020, industry giant Facebook has bucked the trend with revenue growth.
While Facebook is a social media that has changed the world, profit models are one of its drawbacks. More than 99 percent of Facebook's main revenue comes from paid advertising.
According to BigSpy, more than 85 percent of all ads in Facebook's ad categories are made up of e-commerce ads. This overly single revenue structure may put Facebook at risk, especially during this particular period, when the difficulty of cashing in traffic is even more pronounced.

How did Facebook create the counter-attack myth in a tough environment? What measures will Facebook do to save revenue by 2020? It is reported that:
To give users faster access to accurate first-hand information about the outbreak, official media such as Facebook and the Global Health Organization have teamed up to create a new pop-up window on Facebook that points to official health resources when users post about the outbreak.
During the ban, people began to seek online entertainment to spend their time. Facebook offers IGTV for small and medium-sized businesses. Use IGTV to share long videos related to your brand or fan interests to engage your audience more deeply.
To help businesses cope with the new crown crisis, Facebook allows businesses to post temporary service changes on their Facebook pages and Facebook search results pages.
On May 20, 2020, social networking giant Facebook announced the launch of the Shops e-store feature! Merchants can easily create stores on Facebook and Instagram without paying, a move Facebook claims is intended to boost the mobile-first shopping experience.
To reduce the impact of the outbreak on e-commerce and the advertising industry as a whole, Facebook has put in place a number of effective measures to help companies through this particular period. As things stand, Facebook's set of measures did bring the e-commerce industry back to life quickly, and Facebook ads benefited from it.

Let's compare how Facebook's e-commerce ads have changed in the context of the outbreak and the foray into e-commerce during the first and second quarters of Facebook' time.
E-commerce advertising data analysis report for the first and second quarters of 2020
First/Second Quarter Facebook Ad Category Overview: E-commerce Ads Top the List
BigSpy categorizes all the ads captured by the platform in the first quarter and concludes that:
In Facebook's ads for the first quarter of 2020, top3 ads are in the brand e-commerce, app installation and gaming industries. The number one e-commerce ad accounted for 85.58 per cent, while the second-highest proportion of app ads accounted for only 4.43 per cent of total advertising.
E-commerce still accounts for a large share of Facebook's second-quarter ads. Top3's advertising business continued to be e-commerce, app and gaming in the second quarter. The difference is that e-commerce advertising reached 91.22% in the second quarter.
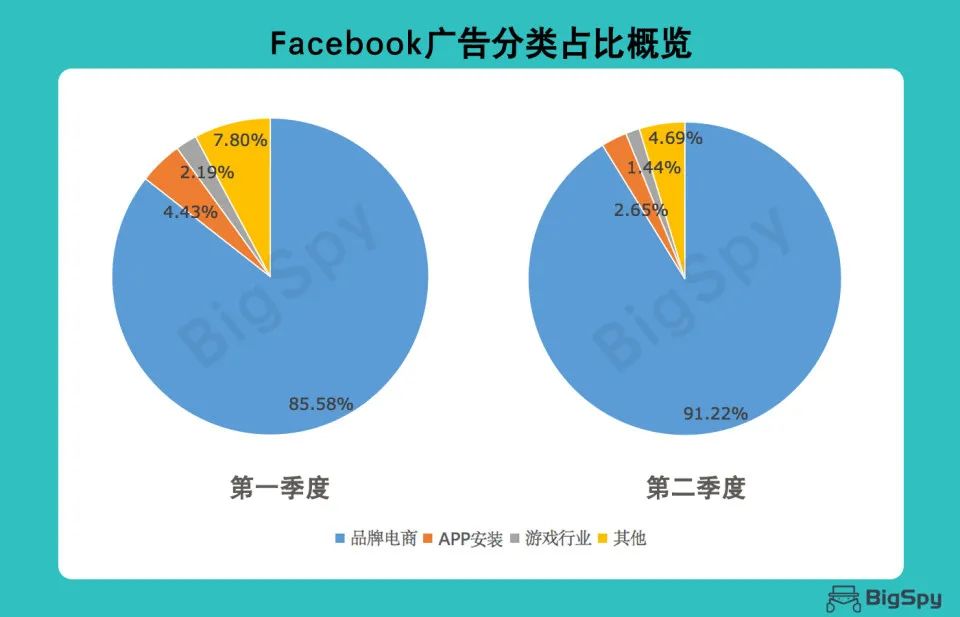
Compared to Facebook's share of ads in the first two quarters, it's clear that e-commerce advertising has been high on Facebook, but it's still on the rise. Facebook was wise to launch e-commerce at a critical time in the second quarter. Facebook's own revenue increase, but also for the vast number of e-commerce advertisers are beneficial, can be said to be a win-win choice.
According to recent Facebook financial statements, Facebook's first-quarter revenue was $1744 billion, up 17 percent from the same period in 2019, and its revenue in the second quarter of 2020 was $1832.1 billion, up 5 percent from the first quarter. Facebook's e-commerce ads are still helping it buck the trend in 2020, under a cloud over the outbreak.
BigSpy analyzed the detailed categories of e-commerce ads on Facebook after discovering that e-commerce ads account for more than 95 percent of Facebook ads. As we all know, e-commerce ads on Facebook are dominated by Shopify sales, direct marketing and membership marketing. Even though many cross-border e-commerce companies are now at the end of their clamor for dividends, there is no denying that Facebook advertising is still the e-commerce industry's preferred advertising platform, the best choice for cross-border e-commerce testing commodity markets.
BigSpy uses big data technology to analyze the detailed secondary categories under e-commerce advertising in 2020 to provide cross-border e-commerce personnel with better ideas when selecting/testing/advertising.
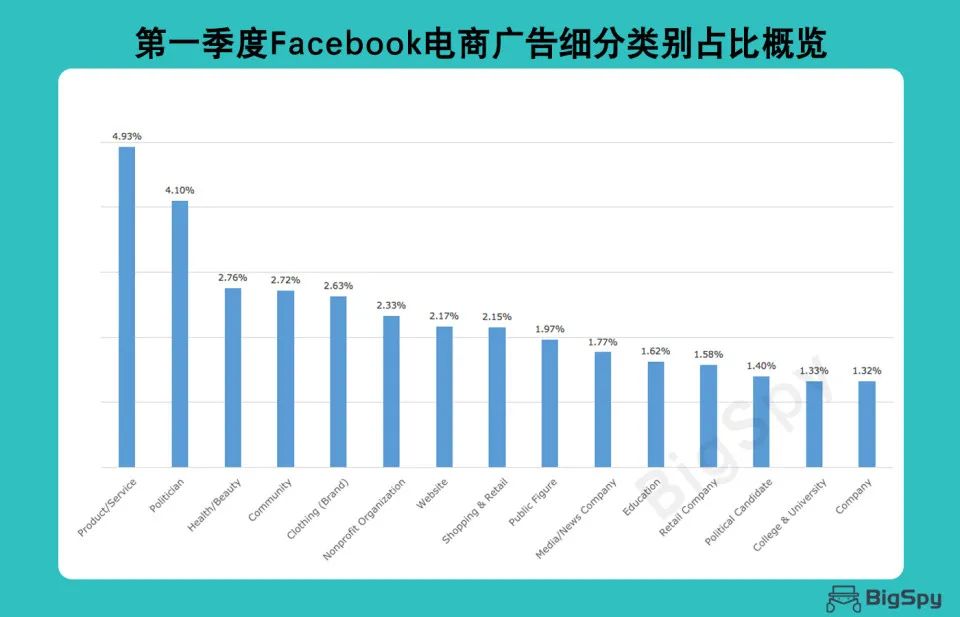
First quarter Facebook e-commerce ad segment analysis: Product/Service ads are the most expected
E-commerce advertising subdivision after a lot of detailed secondary categories, these fine categories in the selection can have a general direction of the advertiser's guidance.
The top five e-commerce advertising categories in the e-commerce category in the first quarter of 2020 are Product/Service( Product/Service), Politician (Politics), Health/Beauty (Health/Beauty), Community (Community), and Clothing (Brand) (Clothing Brands).
E-commerce has a large number of secondary categories, each of which accounts for the highest proportion of e-commerce advertising is Product/Service (product/service), which accounts for only 4.93 per cent of e-commerce advertising. Health/Beauty's e-commerce advertising increased to 2.76 percent in the first quarter as the outbreak hit the home.
Second quarter Facebook e-commerce ad segment analysis: Shopping and Retail category rose to Top 5
The top five advertising categories for e-commerce advertising in the second quarter were Product/Service( Product/Service), Clothing (Brand), Health/Beauty (Health/Beauty), Shopping and Retail (Shopping and Retail), and Community (Community).
At the top of the list was Still Product/Service (Product/Service), which accounted for 5.65 per cent, up 0.72 per cent. A new e-commerce segment has emerged in the top five, with Shopping and Retail accounting for 2.46 per cent of advertising.
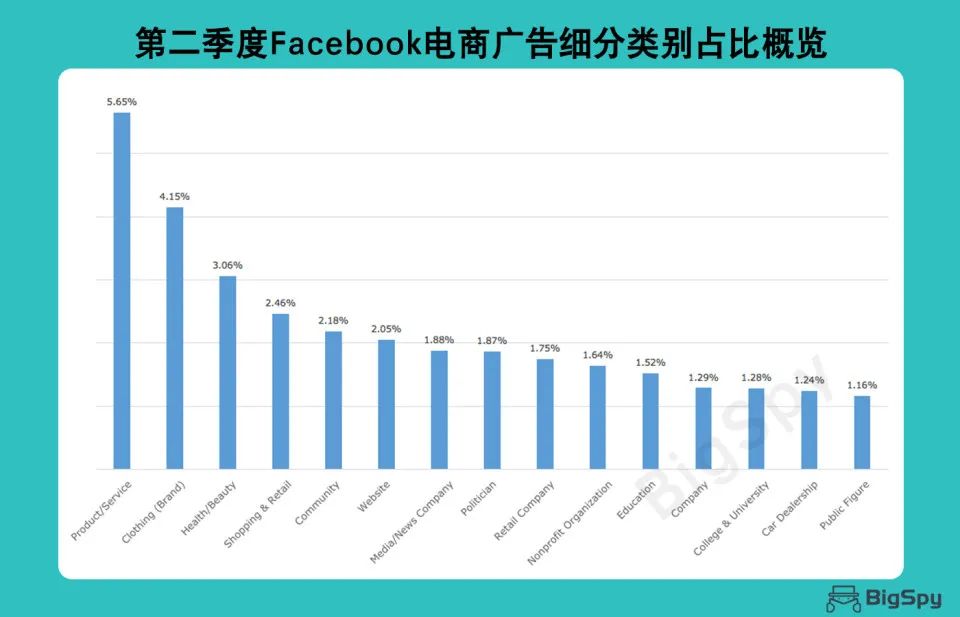
First- and second-quarter e-commerce advertising sub-categories comparison: brand clothing rose significantly, shopping and retailing rose
Clothing Brand (brand clothing) is up significantly. Although the overall outbreak has had a big impact on clothing brands, experts predict that China's apparel industry as a whole will reduce revenue by at least 400 billion yuan this year, and the overall market size will shrink by 15%. But judging by Facebook's share of clothing ads in the second quarter, the apparel market is recovering and the proportion of ads will increase further.
Shopping and Retail jumped from 2.15 per cent in the first quarter to the fourth-highest e-commerce category. Explain that Facebook's foray into e-commerce and partnerships with retail platforms such as Wal-Mart are taking a turn for the better in the third quarter.
Because of the impact of the 2020 environment, some of the previous e-commerce selection experience this year may no longer be useful. Many cross-border e-commerce workers say they face huge challenges in 2020. Under the influence of the epidemic, the daily needs of foreign users have changed dramatically, and the e-commerce selection program brought about by the change in demand is also changing dramatically.
And BigSpy's big data ad selection helps you steadyly grasp the changing needs of your users at this weird time. According to the user's needs to choose the most appropriate, do the first to eat crabs than sell more suitable for the 2020 e-commerce selection theme.
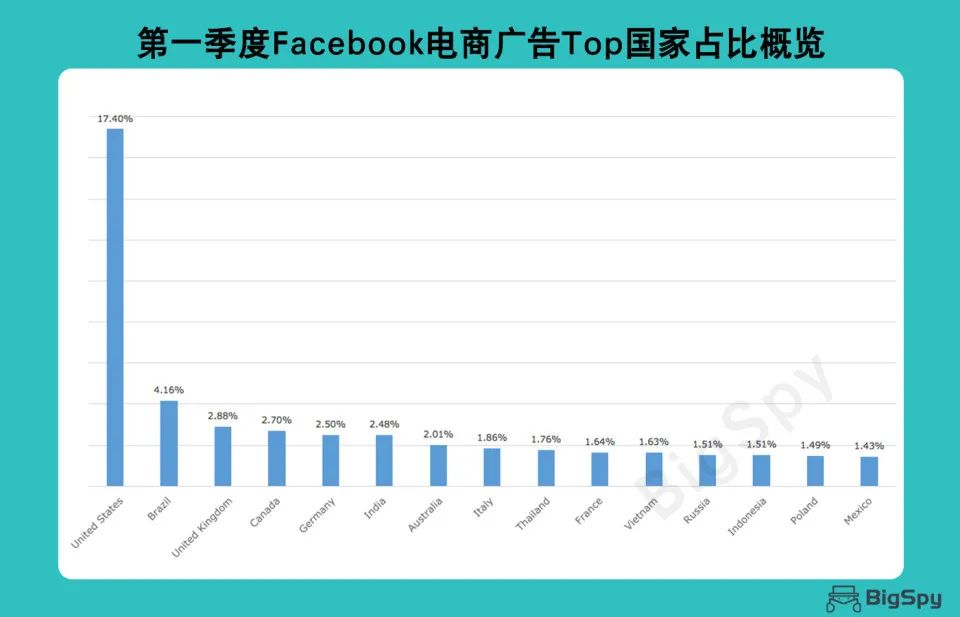
First quarter e-commerce advertising country distribution: the United States accounted for the highest proportion, Brazil second
In addition to the ad creative classification, BigSpy also counts the proportion of e-commerce advertising countries. In the first quarter of 2020, the top five countries for e-commerce advertising were the United States, Brazil, the United Kingdom, Canada and Germany. E-commerce advertising in the U.S. accounted for 17.40 percent, compared with 4.16 percent in Brazil, the second-largest country.
Second quarter e-commerce advertising country distribution: the United States firmly in the first place, the Thai market gradually rise
Facebook's e-commerce ads in the second quarter were in the United States, Brazil, the United Kingdom, Canada and Thailand.
The U.S. still accounts for 17.35 percent of the total, not much less than in the first quarter. The second-largest share of e-commerce advertising in Brazil was 4.81 percent, up 0.65 percent from the first quarter. The fifth-ranked country became Thailand, with Germany in sixth place. Thailand changed significantly in the second quarter, growing by 34% compared with the share of e-commerce advertising in the first quarter.
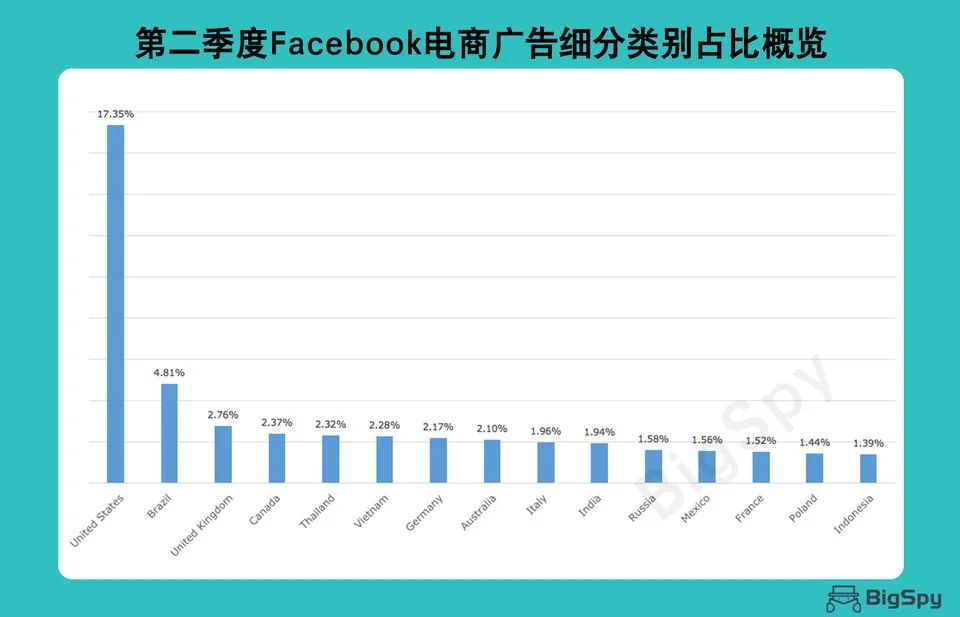
First and second quarter e-commerce advertising country comparison
U.S. and Canada: Only 10.1 percent of Facebook users are in the U.S. or Canada, but 47.8 percent of Facebook's ad revenue comes from the U.S. and Canada. There is a higher market outlook, but there is also more competition.
Brazil: More and more consumers are turning to online shopping during the new coronavirus pandemic. E-commerce sales in Brazil rose 56.8 percent in the first five months of 2020 from a year earlier to about $20.5 billion, according to a survey.
Thailand: This is an emerging e-commerce market, and the Internet is growing rapidly throughout Southeast Asia. And in Thailand, more than half of e-commerce transactions are conducted on social media or on media such as Facebook. Therefore, let us not focus all eyes on Europe and the United States and other developed countries, such as Thailand, Southeast Asian countries e-commerce market is growing rapidly.
4. How is the trend of e-commerce advertising materials developing?
"Making the advertising world transparent" is the original idea of BigSpy to develop this spy tool, BigSpy uses big data technology to analyze advertising ideas, so that more small and medium-sized enterprises are no longer embarrassed by advertising materials. Next, BigSpy will analyze the changes in creatives for 2020 based on platform data.
First/2Q Facebook Creative Analysis: Image material accounted for the highest proportion, video creatives increased significantly
Facebook's first-quarter creatives were mainly in the form of images, videos, turntables and video rotations. Among them, image ads accounted for the largest proportion, as high as 61.68 per cent, and video ads accounted for 20.42 per cent.
In the second quarter, the main format types of Facebook's creatives remained unchanged and still consisted of images, rotations, videos and video recordings. But the proportion of image material was 56.86 percent, down 4.82 percent from the first quarter. Video creatives rose 3.21 percent to 23.63 percent of total ads.
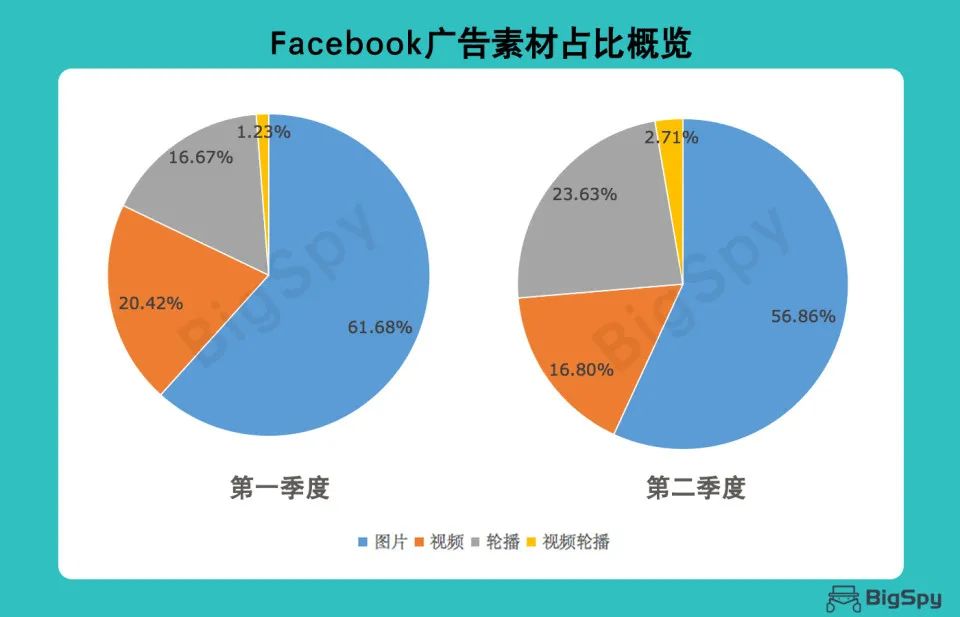
E-commerce advertising trends have become obvious, video advertising will gradually rise, e-commerce creatives become the first choice.
The third quarter of Facebook e-commerce advertising trend
Although Facebook has bucked the trend in the first two quarters of 2020, it is still difficult to maintain steady growth in the third quarter.
For political reasons, 150 brands around the world have agreed to participate in the campaign for blackoutTuesday, suspending all Facebook spending in the United States in July. The brands include Adidas, Starbucks and Coca-Cola, and some have even rolled them out further after Unilever announced it would suspend spending on Facebook and Instagram until at least the end of 2020.
But Facebook's second-quarter results revealed that in the first three weeks of July, our ad revenue growth was about 10 percent year-on-year in the second quarter of 2020. We expect year-on-year ad revenue growth for the third quarter of 2020 to be broadly similar to the performance in July this year.
Although it is now the last month of the third quarter of 2020, there are still many possibilities for Facebook e-commerce advertising in the third quarter.

Go to "Discovery" - "Take a look" browse "Friends are watching"