Industry depth: Facebook's increased ad value is a more important growth driver than exposure
2019Ads contribute about 98% of Facebook's revenue each year.Advertising sales rose 17% to $17.44 billion in the first quarter of March 31, 2020。 The advertising business has succeeded in monecuring the company's 2.4 billion ultra-large user traffic, with North America and Europe being the regions with the highest ARPU per customer, and emerging markets remain to be explored in the future.
2019-2020Tencent, Facebook comparative analysis report
For the public offer of 3000 yuan 1498052617
IPO Before: The rapid growth of users is the main driver, the degree of commercialization is limited, the growth driving force is relatively single; IPO Then to 2014: reduce game-related business revenue, start focusing on the development of information flow advertising, revenue per capita Feeds, Ad load, Ad price revenue formula is established;
2014Q3~2015Q3 : The growth strategy is to reduce Adload.relying on ad price to drive revenue growth, with overallCPM growth as the main driver;2015Q4-2016Q4 becomes driven by both CPM and Ad load factors. Ad impressions knotAfter four consecutive quarters of sharp declines, there was another positive growth (YoY plus 29%, compared with -10% for 15Q3), mainly from Instagram's Ad load;
Starting with 2017 Q1-Q4: Things are starting to change again, with Adprice Retest (up 14% year-on-year in 17Q1) MAU up 17% and ad load flat.
Starting in 2018, Facebook is entering its fifth growth baton switch: average ad price growth is declining, driven by increased ad exposure, behind the commercialization of the mature Instagram Stories, while Whatsapp, Facebook/Messenger Stories are still developing the ecosystem. According to Facebook's 2019Q1 results, Ad ImpressionYoY+32%, advertising price YoY-4%, revenue YoY plus 26%, mainly driven by Instagram Stories, Instagram feed and Facebook News feed.
Chart. 68: Facebook's total ad revenue, total ad exposure, and average ad price growth year-on-year
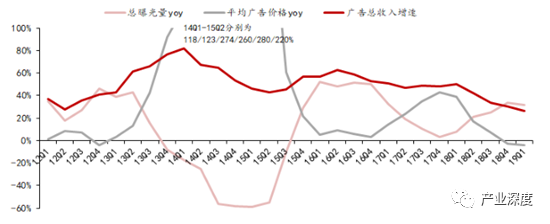
Advertising prices and exposure alternately drive growth, but price increases are more critical. From 2013Q2, the average ad price per thousand ads has increased significantly from $0.19 to $1.85 for 15Q3. After six to seven quarters around $2, it quickly rose again to nearly $3. Advertising price growth is much larger than exposure growth, is the main driving force of advertising revenue growth. The rise in ad prices is partly related to the company's adjusted bidding and display rules (Facebook's restrictions on low-quality ad exposure push up advertisers' cost of single impressions when advertisers budget), and on the other hand, they reflect the value of Facebook's social traffic.
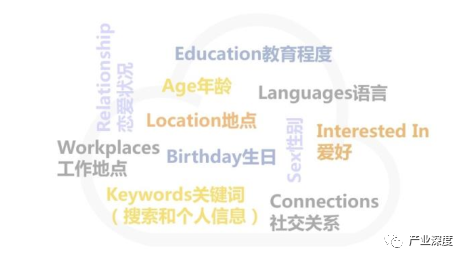
Multi-dimensional depth. Data helps deliver accurately. In addition to its main app, Facebook also has social products for 1 billion users, including Instagram, Messenger and WhatsApp, and the relationship chain covers strong relationships from one-on-one to strangers, with media forms including text, pictures, videos and even VR, and Facebook's account system has accumulated a vast amount of multi-dimensional data on users. Advertisers have a variety of advertising goals to choose from when running ads on Facebook, such as streaming, transforming, promoting brands, and attracting product purchases, to meet diverse marketing needs. After you've set goals, based on large and rich user data, advertisers can target your ads by age, gender, location, interests, education, and more.
Chart. 69: Facebook product matrix
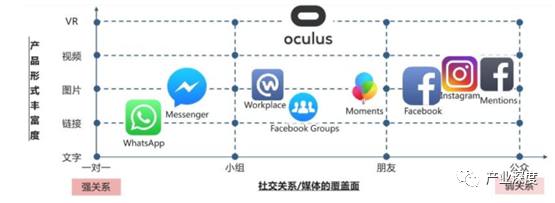
Chart. 71: Facebook ad targeting dimension
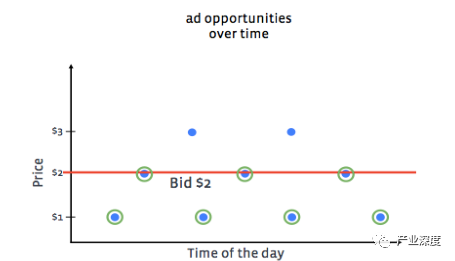
Advanced algorithms ensure efficient delivery. Pacing is a control logic algorithm in Facebook's advertising system that determines how advertisers spend their budgets over the ad lifecycle. In layman's terms, just as a runner can't get the best results by sprinting too early or too late in a race, pacing algorithms allow advertisers to automatically allocate budgets in the competition to ensure that advertisers get the maximum ROI. As shown in the figure below, the blue dot represents the opportunity for the ad to be displayed, the yellow circle represents the ad wins the display, and the red line represents the bid price.
No Pacing algorithm (accelerated delivery): Without Pacing, advertisers' budgets are consumed cleanly (potentially expensive clicks) in a short time from the start, with intense early competition and no competition in the later stages, resulting in a certain waste of resources. The result is higher average costs, but advertisers get the most out of their ad-based settings.
No Pacing algorithm (underbidding): In this case, the lowest click-through price is pursued, but the advertiser's budget is not used up in the end, and the final ad performance is the worst
Pacing Equilibrium under the algorithm: Advertisers get the most clicks, get the most revenue, and run out of daily budgets.
Chart. 72: Facebook ad targeting options
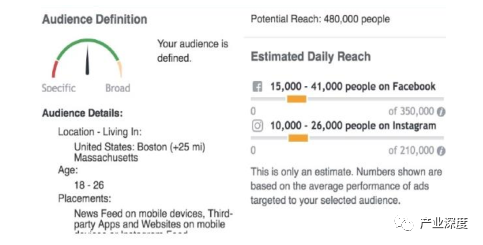
Chart. 75:P run when using the acing algorithm (balanced state)
The body directory
1TencentFacebookFinancial.
1.1Tencent's financial situation
1.2、FacebookFinancial position
2TencentFacebookThe user platform
2.1Tencent user platform
2.1.1Social.&IM
2.1.2video platform
2.2、FbThe user platform
2.2.1、FBSocial.
2.2.2、FbVideo platform
3TencentFacebookCommercial realization
3.1Tencent Commercial Realization
3.1.1Game.
3.1.2Fintech
3.1.3advertising business
3.1.4, prospects
3.1.5Tencent.AIStrategy.
(1), the base layer
(2), the technical layer
(3), the application layer
3.2、FBCommercial realization
3.2.1, advertising forFacebookThe main realization mode
3.2.2expansion of emerging marketsARPU
3.2.3、FacebookFinance begins to commercialize
3.2.4、FacebookAR/VRStrategy.
(1), the next generation of universal computing platform
(2Business model: hardware+The content is one wing
4、TencentFacebookOutlook
Chart catalog
Chart 1:2012-2019Global social giant market capitalization (US$100 million)
Chart 2:2018-2020Tencent's revenue composition and trends in the first quarter of the yearUnit: RMB million
Chart 3:2016-2019Annual Tencent Revenue (100 million yuan)
Chart 4:2016-2019Annual Tencent fee rate
Chart 5:2016-2019Annual Tencent gross margin
Chart 6:2016-2019Annual Tencent Net Profit (RMB 100 million)
Chart 7:2009-2019Facebook Operating income (US$ billion)
Chart 8:2009-2019FacebookProfit margin and expense rate
Chart 9:2009-2019Facebook Net profit
Chart 10:2010-2019FacebookRevenue split
Chart 11:FaceBookTencent product matrix
Chart 12: Tencent: With WeChat / QQTencent: To WeChat / QQ The two platforms are centered
Chart 13: Platform; Interest Tribes build a community of user interests
Chart 14:2016-2019Number of users of the company's social platform
Chart 15:2018-2020Tencent's active user size in the first quarter of the year
Chart 16: Tencent VideosMicroscopy
Chart 17:Facebookwatch & IGTV
Chart 18:2017-2020Three domestic online video MAU (Millions)
Chart 19:2017-2020Domestic short video MAU
Chart 20: Online social product matrix
Chart 21: Revenue Structure Split (2019Q4)
Chart 22:FacebookStreaming ads
Chart 23: The company's products complement each other
Chart 24:2018-2019FacebookIts products to heavy user size total
Chart 25:2014-2019U.S. Market APPThe share of downloads
Chart 26:FacebookCompete with Google in video streaming
Chart 27: The share of fintech revenue is gradually increasing
Chart 28: The gross margin of online advertising has improved significantly
Chart 29: Tencent Deferred Revenue (100 million yuan)
Chart 30: Peace Elite, King Glory Global Internal Purchase Revenue (millions of U.S. dollars)
Chart 31: Tencent Key Game 2020Year 3 Monthly domestic bestseller list ranking
Chart 32:DNFThe hand tour version is expected in 2020H1End online
Chart 33:2018-2019Annual Tencent government cloud orders of more than 100 million yuan
Chart 34: Tencent Cloud Enterprise Services
Chart 35: Cloud Computing: Fast growth, close to half the level of Ali
Chart 36:2018-2019Annual domestic cloud vendor revenue data (100 million yuan)
Chart 37:2019Domestic share of cloud computing in the year
Chart 38:2015-2019The size of third-party mobile payment transactions
Chart 39: Share of third-party mobile payment transaction size
Chart 40:2018-2020Tencent's online advertising revenue grew in the first quarter of the yearUnit: RMB million
Chart 41: WeChat social advertising products
Chart 42: Tencent APP and the business matrix
Chart 43: Tencent's vertical sector of out-of-country investment
Chart 44: Overall APP mid-MAU More than 500 the number of million and the number of WeChat programs
Chart 45: Tencent video data performance
Chart 46:2017-2019Year-on-year growth rate of Tencent's social advertising
Chart 47: Penetration rate of Internet users in all regions of the country
Chart 48:2018 Comparison of e-commerce user penetration rates in all regions of the world
Chart 49: Increased share of overseas game revenue
Chart 50:2015-2022Global regional market game revenue share structure
Chart 51: Basic calculation - general technology - application scenario
Chart 52:2018 Year 9 March 30 Tencent's adjusted organizational structure
Chart 53:AIThe smart cloud of the service
Chart 54: Tencent Cloud Solutions for Different Industries
Chart 55: Tencent's main AIThe time when the laboratory was set up
Chart 56: Tencent's three AILaboratory.
Chart 57: Tencent AILabFocus on four basic research and application exploration combined
Chart. 58: Tencent Youtu Lab research, scenarios, data integration
Chart 59: WeChat AI The team makes the product smarter
Chart 60: Tencent AI Experience Center, Tencent Listen to Smart Speakers and Tencent Translation Jun
Chart 61: Tencent technology robot DramwriterAuto-written press releases
Chart 62: The king honors the first intelligent robot
Chart 63: Time for mainstream social platforms at home and abroad to launch streaming ads
Chart 64:FacebookThe form of information flow advertising
Chart 65:FacebookAd revenue drivers split
Chart 66:FacebookTotal ad exposure
Chart 67:FacebookAverage ad price
Chart 68:FacebookTotal advertising revenue, total ad exposure, and average ad price growth year-on-year
Chart 69:FacebookThe product matrix
Chart 70:FacebookOptional ad targets
Chart 71:FacebookAd targeting dimensions
Chart 72:FacebookAd targeting selection
Chart 73: No PacingAd serving at the time of the algorithm (accelerated delivery)
Chart 74: No Pacing Ad serving at the time of the algorithm (underbidding)
Chart 75:PacingAd serving at the time of the algorithm (balanced state)
Chart 76:2017-2019FacebookIncome structure (millions of United States dollars)
Chart 77:2010-2019年Facebook ARPU Structure (USD)
Chart 78:InstagramstoriesProgress in commercialization
Chart 79:InstagramstoriesAd style
Chart 80:2018-2019Internet penetration in some countries
Chart 81:2017-2019Global ARPU(USD)
Chart 82:2010-2019Facebook Global MAU (Millions of people)
Chart 83:Facebook: E-commerce Payments are about to be commercialized
Chart 84:FacebookAbout marketplaceexpression
Chart 85: U.S. P2PThe size of the payment transaction
Chart 86: North American e-wallet penetration and mobile payment scale
Chart 87:Facebooksuffered from data privacy penalties
Chart 88:FacebookAR/VRStrategy.
Chart 89:OculusThe market share has steadily increased
Chart 90: Mainstream VRManufacturer's equipment shipments (millions)
Chart 91:OculusThe main way to make money
Chart 92:AR/VRThe main application direction
Chart 93: Average daily online time (min) for users of short video apps in China
Chart 94:VooVMeeting Global ranking
Chart 95: Changes in the type of advertising market in the United States
Chart 96:FacebookVideo feature Watch
Chart 97: North American advertiser channel strategy changes
Chart 98: North American advertiser delivery policy selection
Send to the author