Python Data Analysis Practice (1) Data Analysis Overview

Author: Corley
Source: Quick learning python
First, get started with data analysis
1. Fundamentals of the big data age
The development of the big data industry: Data is now availableExplosiveevery minute there may be:
More than 13,000 iPhone apps are downloaded A new tweet of 98,000 was posted on Twitter Send out more than 168 million emails Taobao double eleven 10680 plus new orders 12306 tickets 1840 plus
In the age of big data, there are three major changes:
From random samples to full data From accuracy to confuseness From cause and effect related to the relationship
To give a typical example: men who buy diapers at the supermarket buy some beer along the way, and the results from big data analysis prompt supermarkets to put some beer near the shelves of diapers, thereby increasing sales, there is no causal relationship between buying diapers and buying beer, but there is a correlation.
The status of big data applications in China is as follows (from CSDN):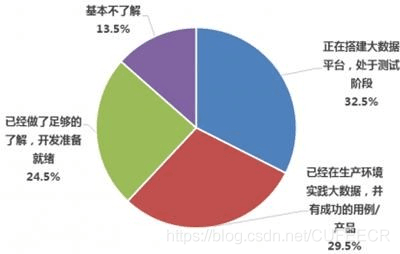
As you can see, big data applications already have a certain scale, but there is still a lot of room for development.
The demand for talent mainly includes:
Data analyst Statistical analysis Predictive analysis Process optimization Big data engineer Platform development Application development Technical support Data architect Business understanding App deployment Architecture design
Data analysis is being learned because it is becoming more common and inexpensive, and analytics can provide data with scarcity and comes with itExtra valueservices.
2. Data analyst career prospects
Issues that data analysts need to address:
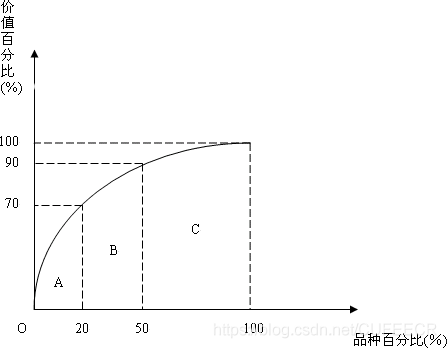
Estimating demand and allocating capacity In the age of big data, the ability to interpret data is even more needed. Q: The oven has limited capacity, which types of bread should I choose to produce? A: List the most popular breads and give priority to productionStar merchandise。 The key is to find star merchandise, which needs to count the total turnover of bread, and then calculate the relative proportion of each bread to total turnover, giving priority to the production of a product portfolio that can cover 70% of turnover. This uses the statistical number of allocation tables and histograms, also known as ABC analysis, as follows:
Assessing the effectiveness of marketing programs Statistics is not a good way to analyze the data, from the results of the analysis to guess how to affect customer behavior, and to formulate it as specificBusiness planand act accordingly is the key. Q: Which ad is more effective if you want to sell bread online? A: Write two types of papers and advertise them for a while to see how effective they are. The best way to compare the effectiveness of your ads is to use statisticsRandomized controlled experiments, let two kinds of ads appear randomly, after a period of time, observe which ads are better, and then widely use the effect of better ads.
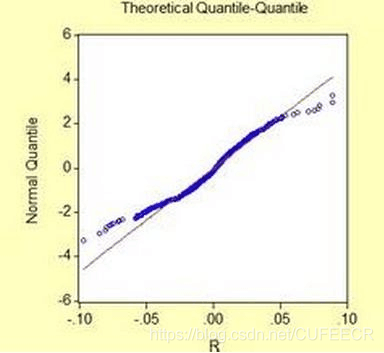
The relationship between product quality control finding results and the reasons for their formation is important. Q: How to judge from the bread, the baker did not steal the cut? A: Check a few breads, scales to see if the weight gap is too large. You need to know the average weight of bread before sampling it to see if the weight of bread is a normally distributed bell curve. If it deviates from the curve, it may suggest that there is a problem with the bread tube. As follows:
A good data analyst is a good product planner and industryThe front-runnerIn IT companies, good data analysts are promising to be at the top of the company.
The data analyst's workflow is as follows:
Three tasks for data analysts:
Analyze history Predict the future Optimize your selection
8 skills required by data analysts:
Statistics. Statistical tests, P-values, distributions, estimates Basic tools Python SQL Multivariarial calculus and linear algelus Data consolidation Data visualization Software. Machine learning The thinking of data scientists Data-driven Problem solved
Three capabilities required by data analysts:
Statistical foundation and analysis tool applications Computer coding capabilities Knowledge of a specific application area or industry
Typical data analyst growth: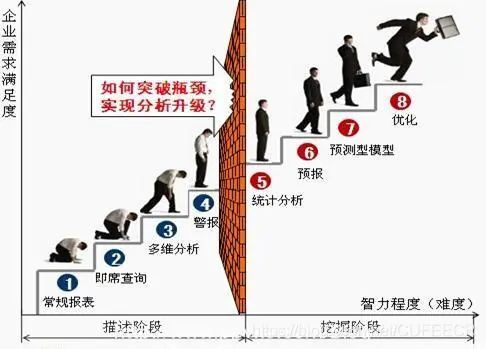
3. The road to becoming a data analyst
Self-cultivation as a data analyst:
Sensitive. Explore. Meticulous. Pragmatic.
The skills that data analysts need are as follows:
Be familiar with Excel data processing Data sensitivity is high Be familiar with the company's business and industry knowledge Master data analysis methods relevant analysis Regression analysis Cluster analysis The method of judgment analysis The main component analysis method Factor analysis Corresponding analysis The time series Comparative analysis Group analysis Cross-analysis Structural analysis Funnel analysis Comprehensive evaluation and analysis Factor analysis Matrix association analysis Basic analysis methods Advanced analysis methods
The content and responsibilities of data analysis practitioners in different industries:
Work in data analysis Learn to do daily newspapers A table of daily sales and inventory classes Product sales forecast Inventory calculations and alerts Traffic analysis related tables Re-plate Data analysis mining staff Provide data support for product optimization Verify product improvements Provide messages and reports to the top Internet plus analysis KPI indicator monitoring Various periodic reports Make an analysis report on a business problem Offline modeling and analysis for the business
Data analysis is an important subject based on mathematics, but it doesn't matter if math is bad, it can be usedPythonTo help learn: Python is not only a programming language, but also the basis of data mining machine learning and other technologies to facilitate the establishment of automated workflows; Python is not difficult to get started, it is not too demanding on mathematics, it is important to know how to express an algorithmic logic in language; Python has a lot of encapsulated tools and commands, I want to do is to solve a problem with what mathematical methods, and build it.
To get started with Python data analysis quickly, use Python-related toolkits: (1) Python's biggest feature is that it has a large and activeScientific calculationsCommunity, the trend towards python for scientific computing is also becoming more pronounced. (2) Since Python has an ever-improving library, making it a big alternative to data processing tasks, combined with its strength in general programming, it is entirely possible to build data-centric applications in Python as a language, where:
Common data analysis libraries Numpy Scipy Pandas matplotlib A commonly used advanced data analysis library nltk igraph scikit-learn
(3) As a scientific computing platform, Python's can easily integrate C, C, and Fortran codes.
Preparations for data analysis:
Learn about the data Data cleaning and preliminary analysis Drawing and visualization Data aggregation and grouping Data mining
Common algorithms for data analysis and data mining:
Linear regression Time series analysis Classification algorithm Clustering algorithm The down-dimensional algorithm
The methods of learning and working in data analysis are:
Thoughts on work Do more More summary
Conclusion.
The above is the whole content of this article, I hope the content of this article for everyone's study or work has a certain reference learning value, thank you for your support of the small editor.

Go to "Discovery" - "Take a look" browse "Friends are watching"