Google search network ad spending up 20% in 2017


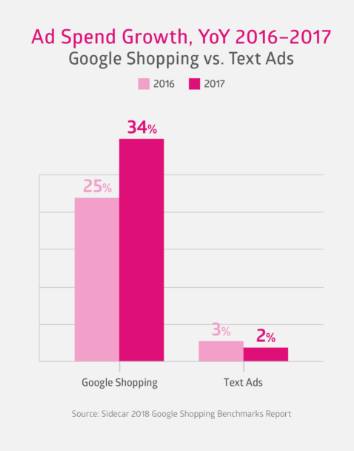
U.S. retailers are prioritizing text ads for Google Shopping, according to a new survey released by Sidecar. According to an analysis of the activities of more than 300 U.S. retailers, Google Search's advertising spending grew by 20 percent, while Google Shopping's advertising growth rate (34 percent) was much higher than that of text ads (2 percent).
PC-to-mobile shopping transformation accelerates
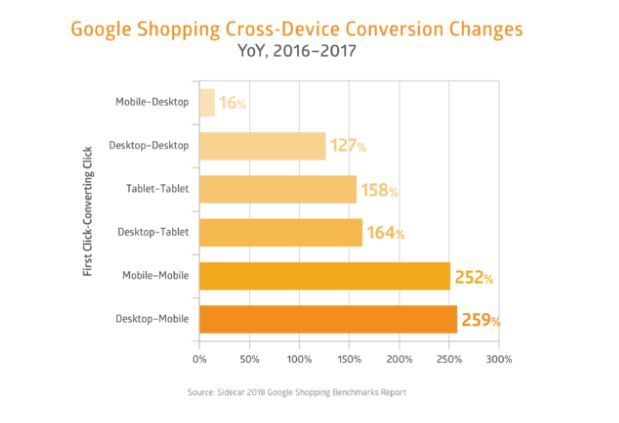
Previous data show that consumers do research on mobile devices, but buy on PCs. However, recent studies suggest that this may change. Sidecar found that the number of PC-to-mobile shopping paths nearly tripled from the same period last year. Specifically, shoppers started shopping on PCs and completed purchases on mobile phones, up 259 percent.
By contrast, while the purchase path to the PC increased by only 16%.
Mobile's share of revenue increased
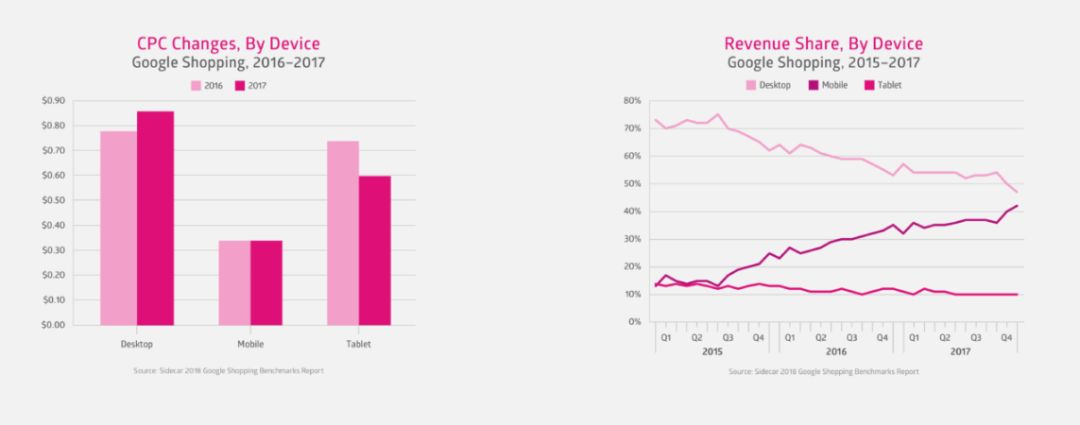
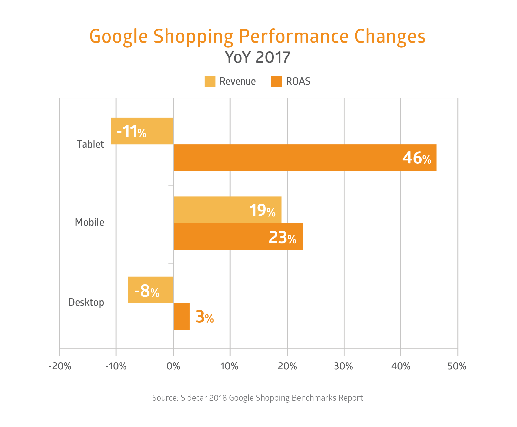
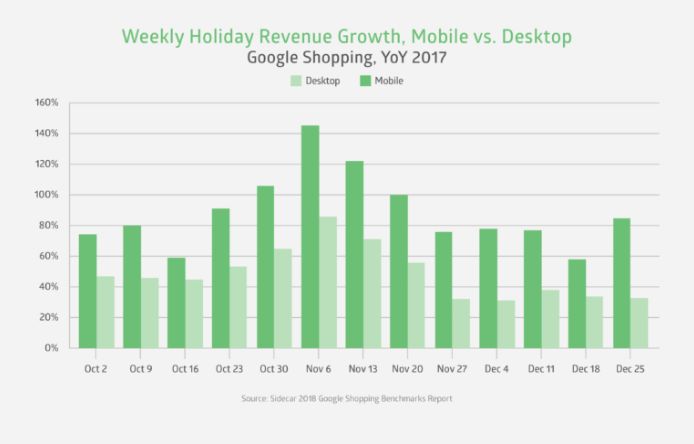
Given the increasing comfort of mobile conversion, it's no surprise that revenue favors smaller screens. In fact, Google Shopping's share of mobile retailer revenue rose 19 percent, at the expense of tablets (-11%) and PCs (-8%).
Interestingly, despite the decline in tablet revenue, the return on advertising expenditure (ROAS) increased by 46 per cent.
All in all, mobile phones accounted for more than 40% of Google Shopping's revenue in the fourth quarter of 2017. Mobile phones are almost equal to the PC's share of revenue.
Overall, mobile devices (phones and tablets) account for the majority of Google Shopping's revenue.
Amazon is the main retailer of Google Shopping
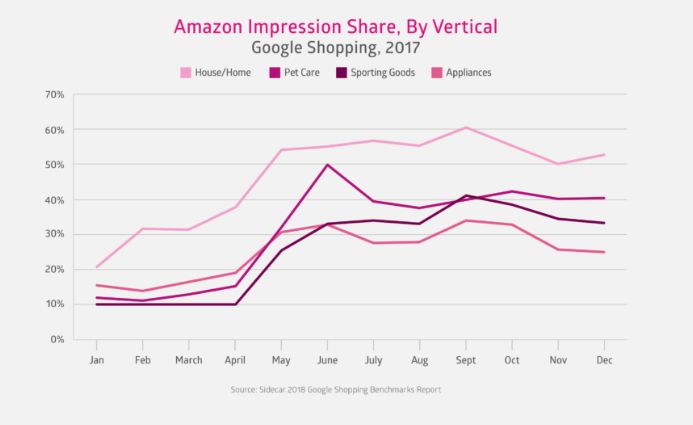
Amazon has invested more in Google Shopping, although its share of key verticals started this year is fairly limited. Amazon's share of the pet care vertical reached about 50 percent in June and 40 percent in September.
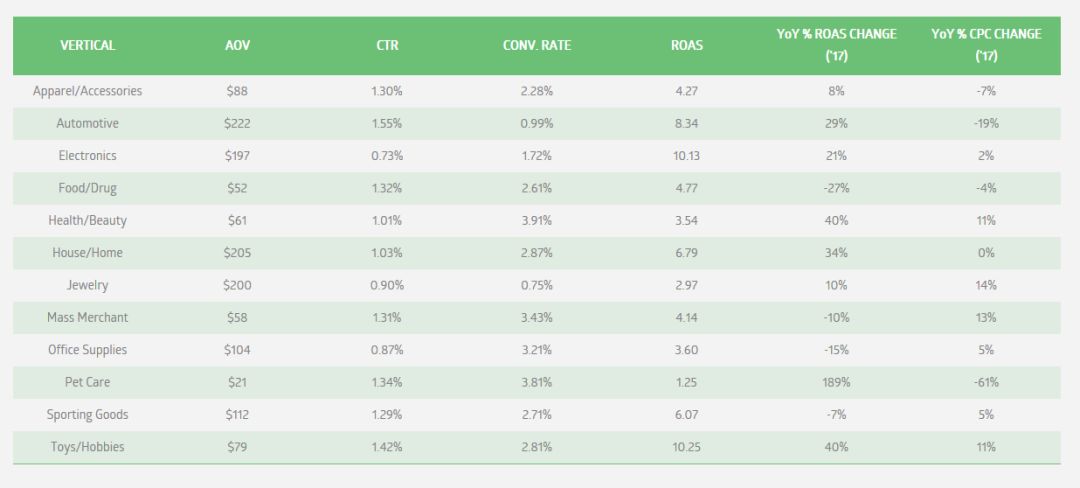
Performance benchmark: Electronics advertising spending returns are among the highest
Average order value (AOV): car ($222), home/home ($205) and jewelry ($200);
CTR: Automotive (1.55%), Toys/Interests (1.42%) and Pet Care (1.32%);
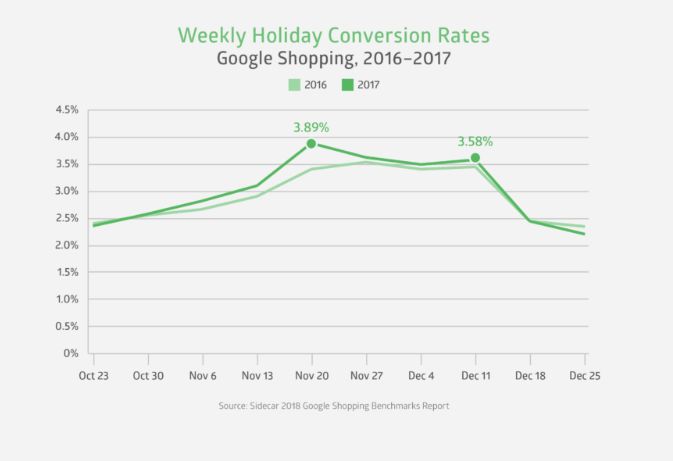
Conversion rates: health/beauty (3.91%), pet care (3.81%) and mass merchants (3.43%);
Return on advertising expenditure (ROAS): toys/interests (10.25), electronics (10.13) and automobiles (8.34);
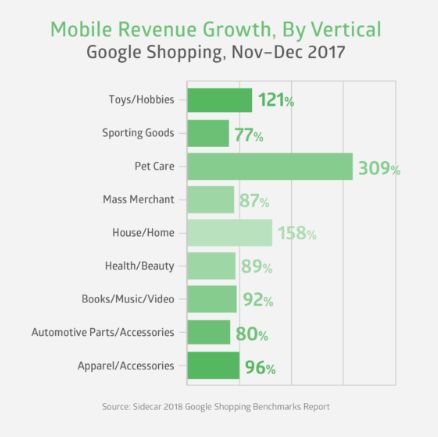
Year-over-year change in return on advertising spending: Pet Care ( .189%), Health/Beauty (+40%) and Toys/Interests (+40%).

Support 199IT development, can join the paid high-end knowledge exchange group, thank you!

Highlights of 199IT Top Reports can be found directly at:
GWEC: Annual Report on the State of the Global Wind Power Industry 2017
The Power of Equality: The Path to Gender Equality in the Asia-Pacific Region
Automotive as a Service: Medium-term opportunities for fleet management solution providers
2018 AI Frontier Report: Application and Value of Deep Learning
The 2017 Survey of Television Viewer's Ways and Means for All Nations in the United States
E-commerce White Paper: Brands in China e-commerce breakout battle
Q4 2017 and full-year review of IPOs in the global technology industry
Virtual Reality 101 Research Report: Children Experience VR Device Behavior Analysis
Amazing figures: About 12% of our annual waste at the dinner table
2018 White Paper on the Concept of Wealth for the New Second Generation
Report: More than half of young people are reducing their use of social media
Artificial Intelligence: The New Value Creation Engine for the Automotive Industry
Report: The security of personal data has the greatest impact on brand trust
| NOTICE |
WeChat's public platform is currently available for subscriptionsNumber top function
Click on our home page
Check the top public number
Capture great content in a timely manner
For business cooperation, please contact Microsyscope: dingli Admin@199it.com.

Go to "Discovery" - "Take a look" browse "Friends are watching"