2019 China Exhibition Data Statistics Report


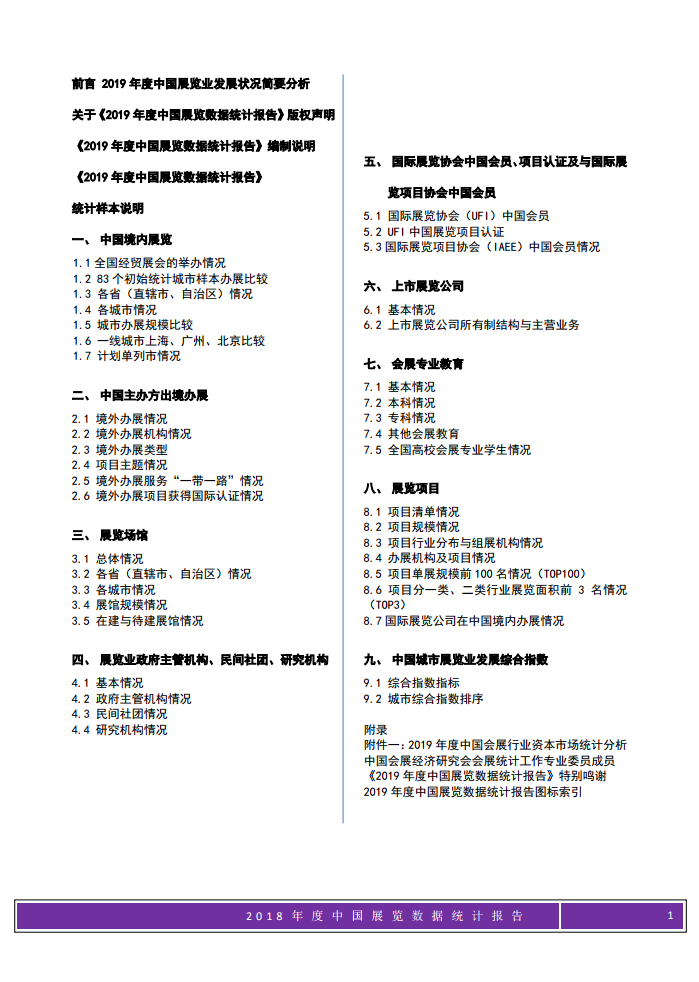
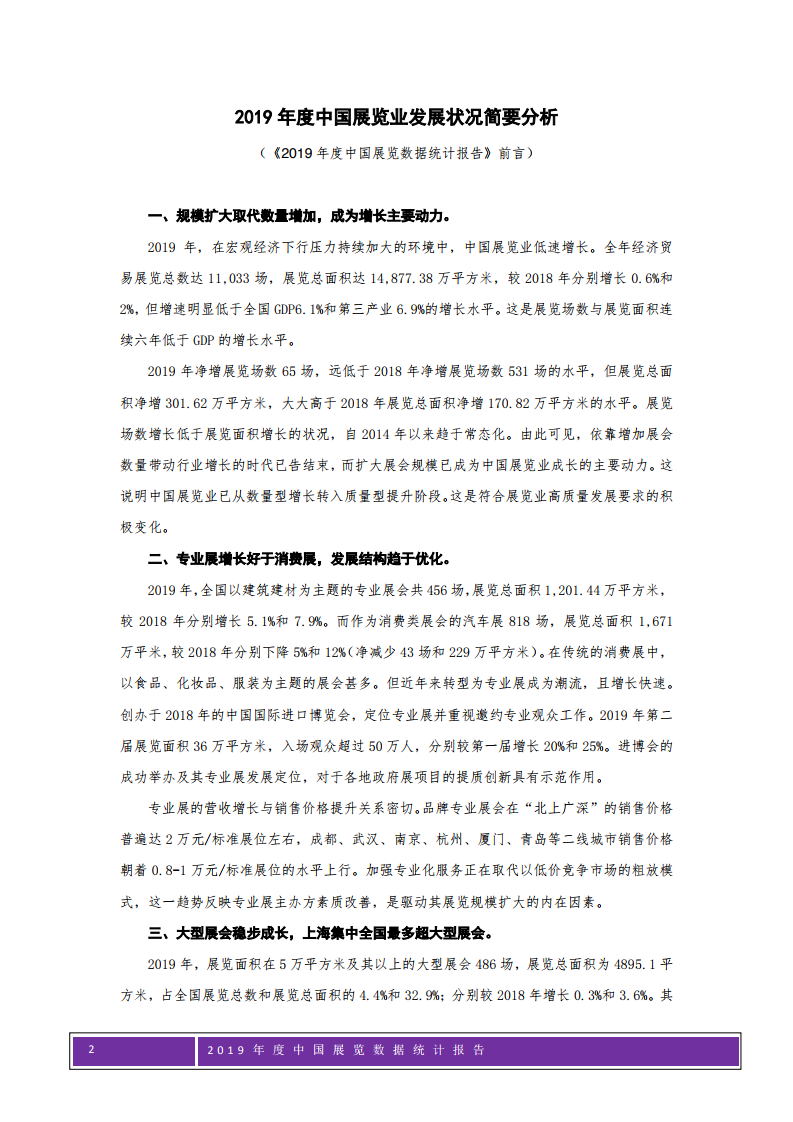
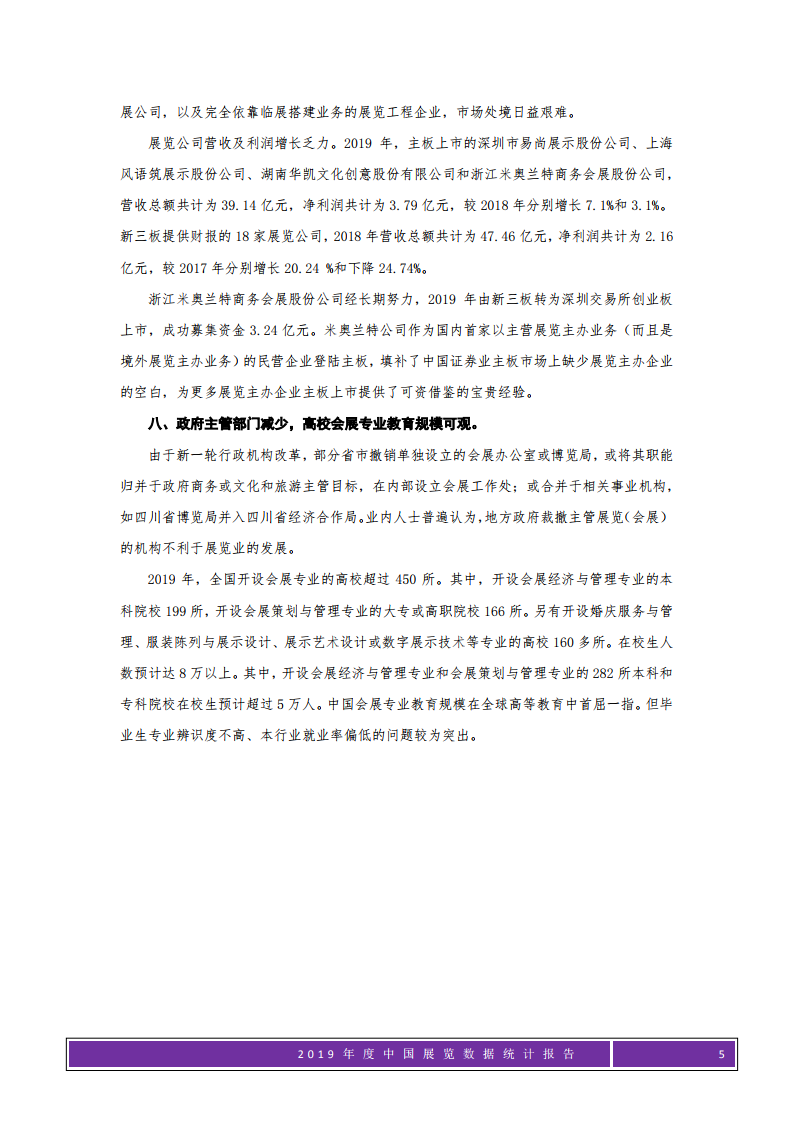
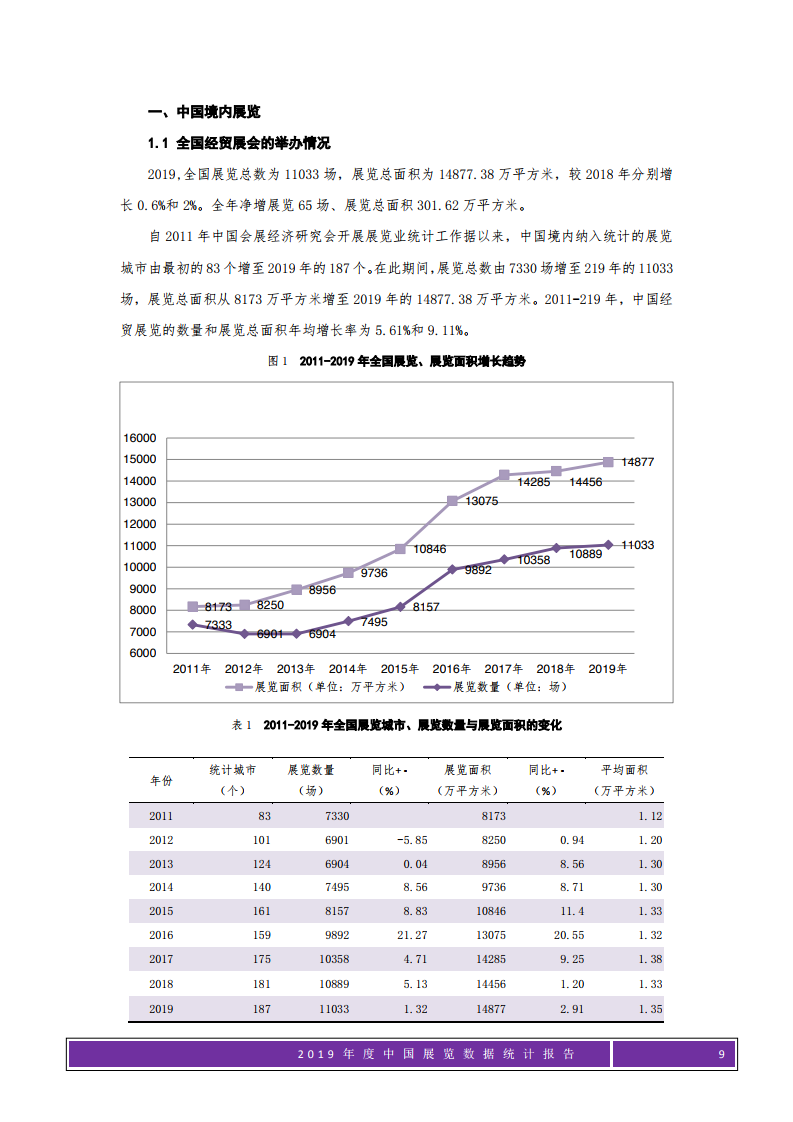
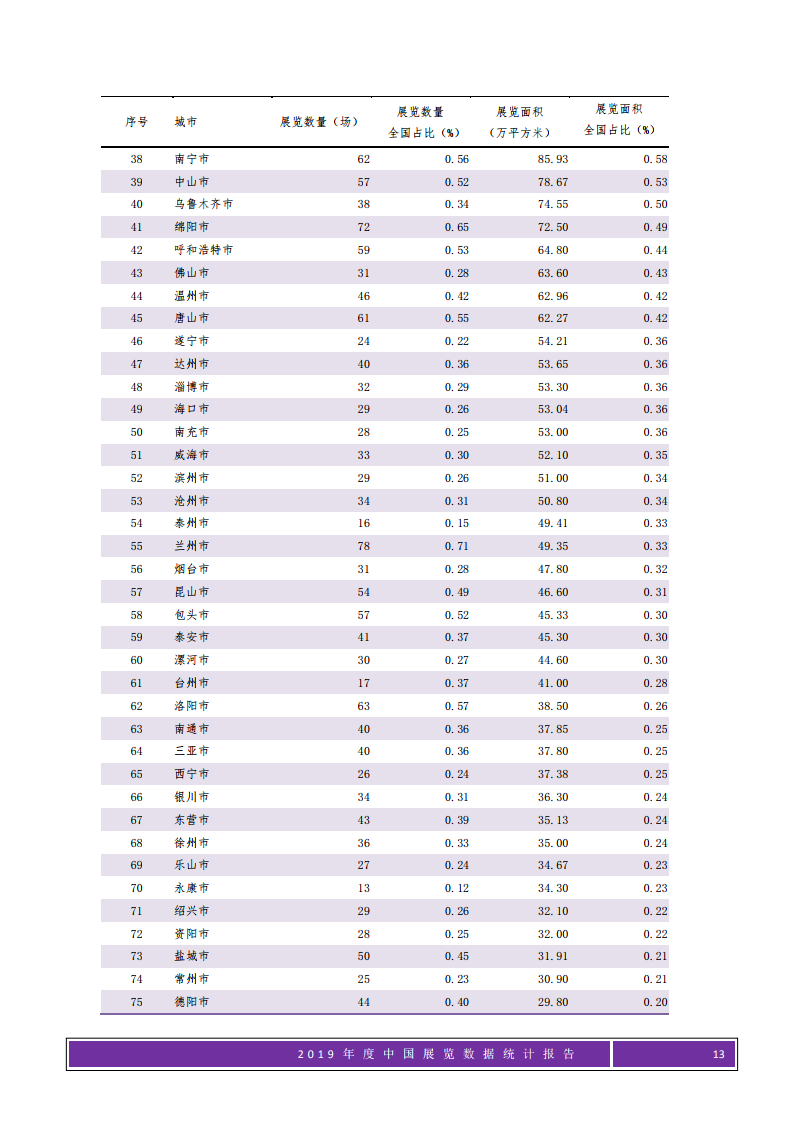
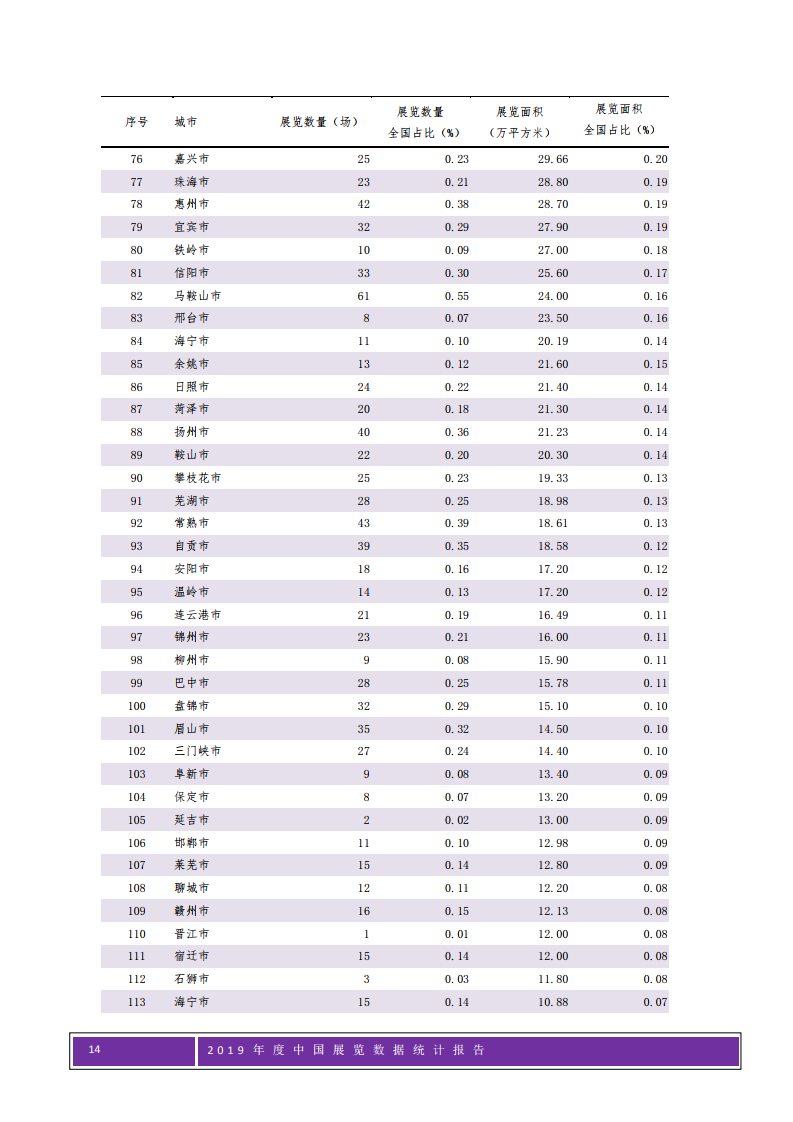
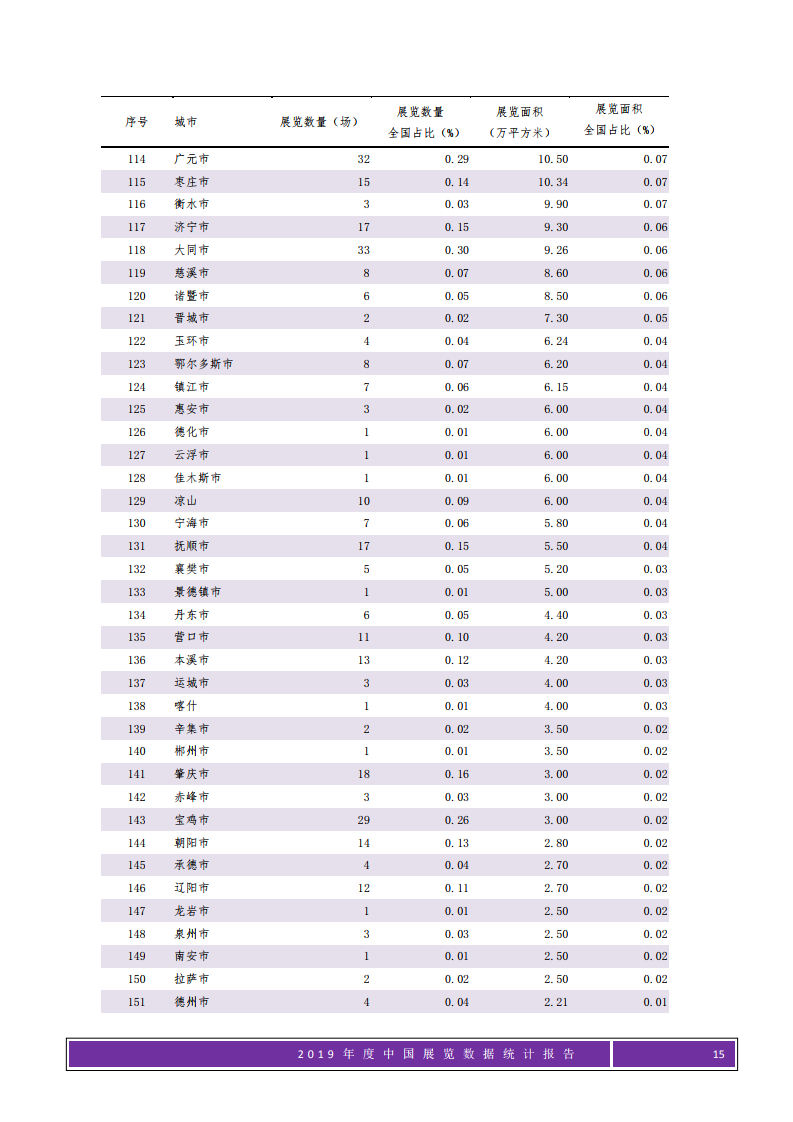
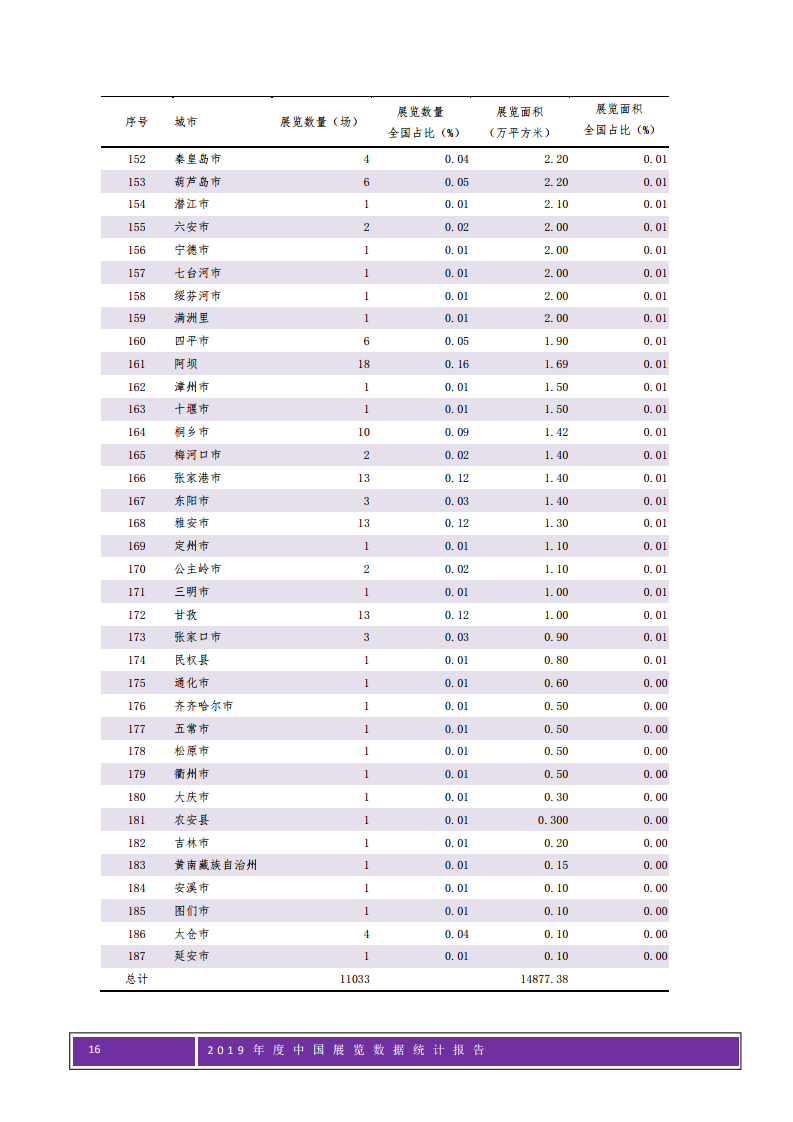
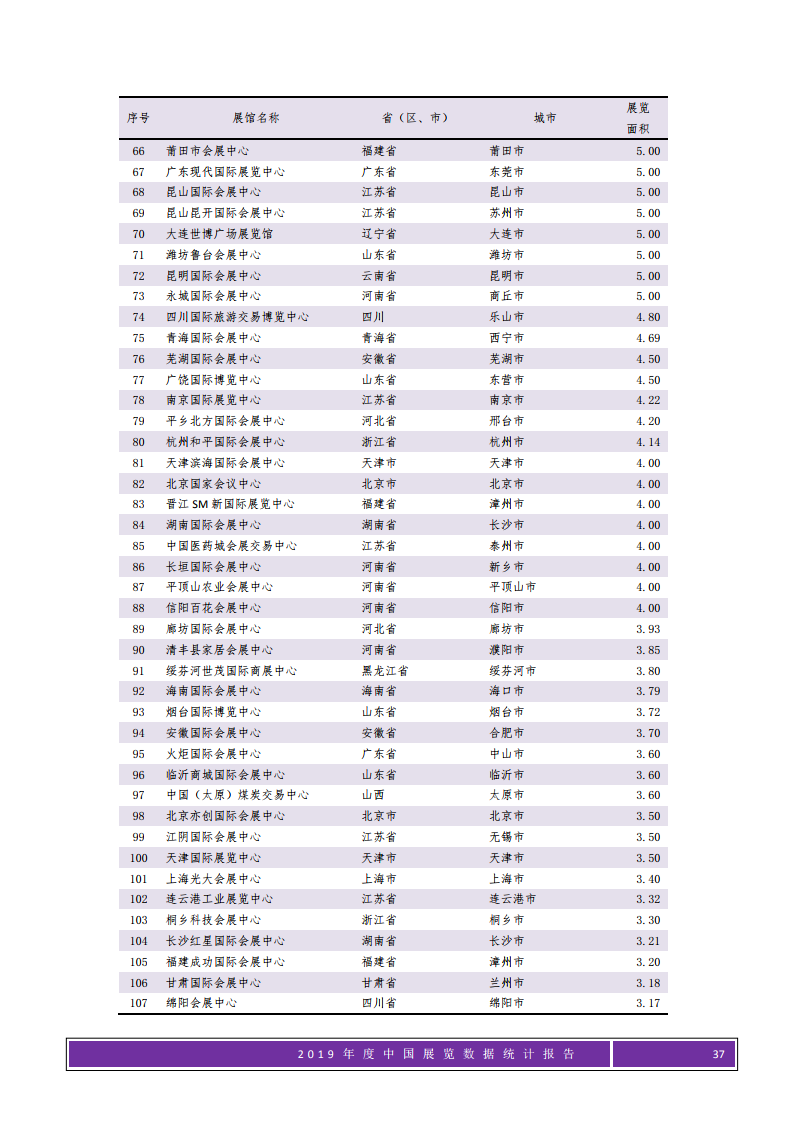
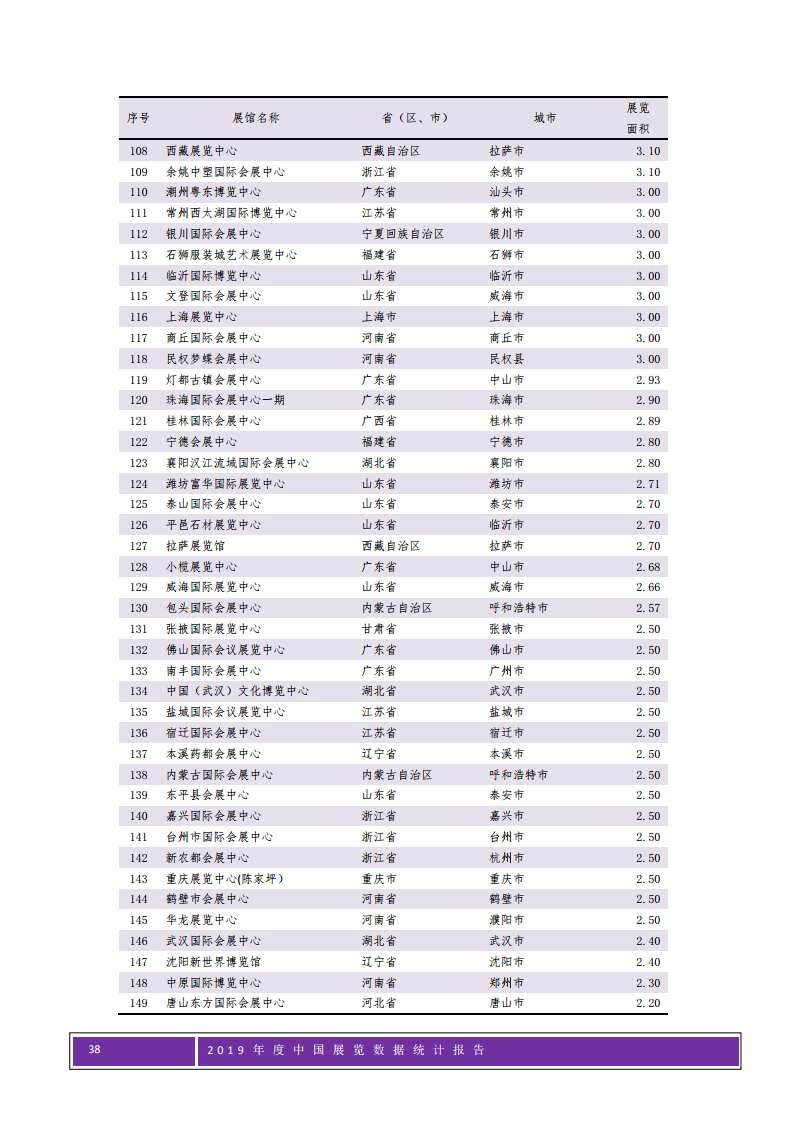
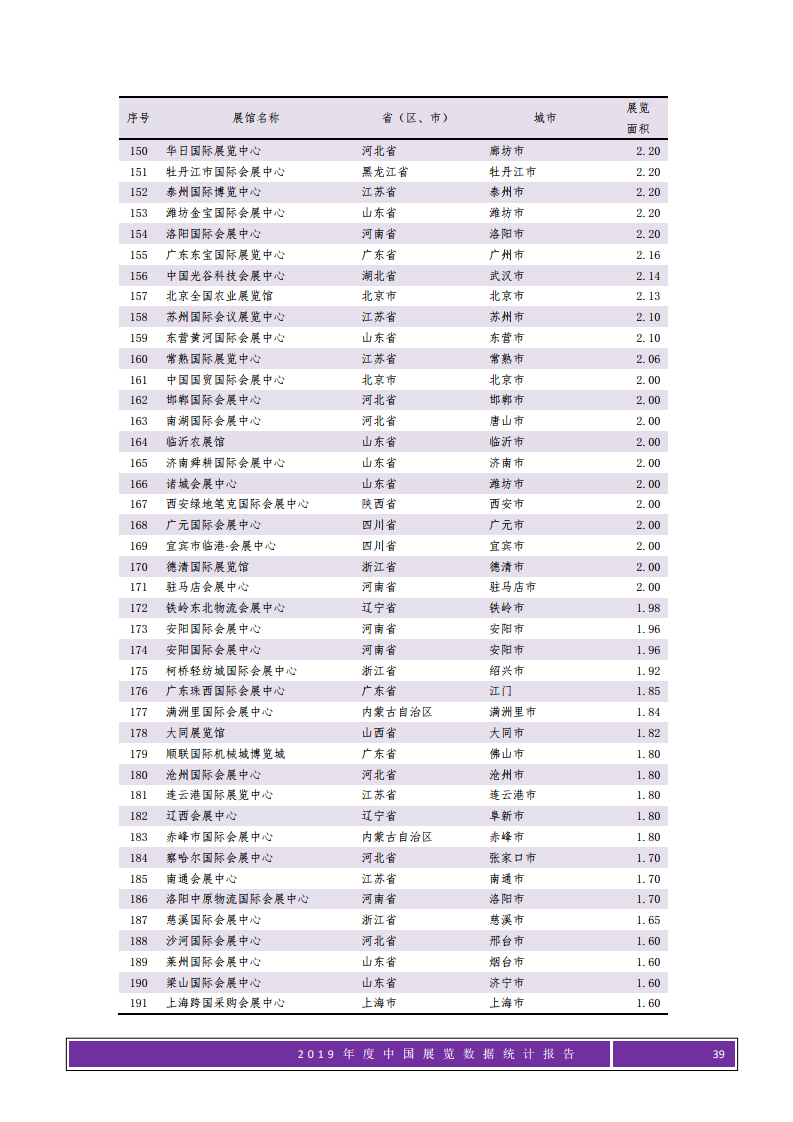
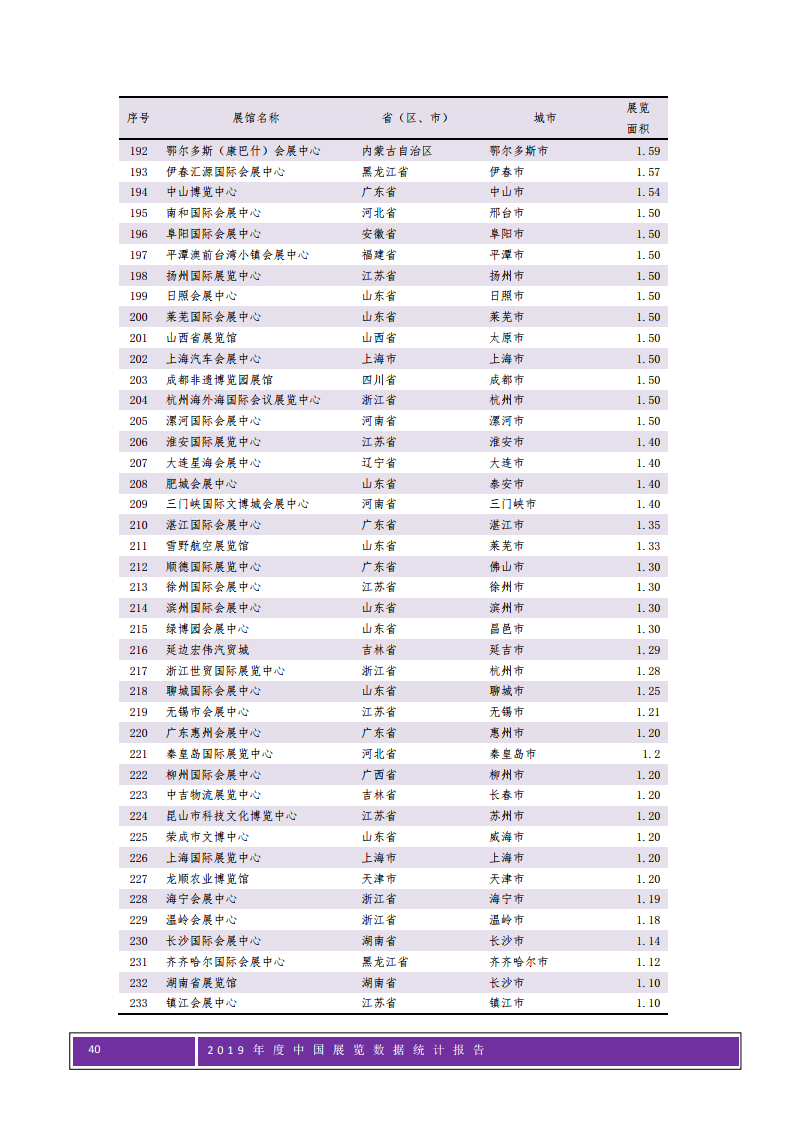
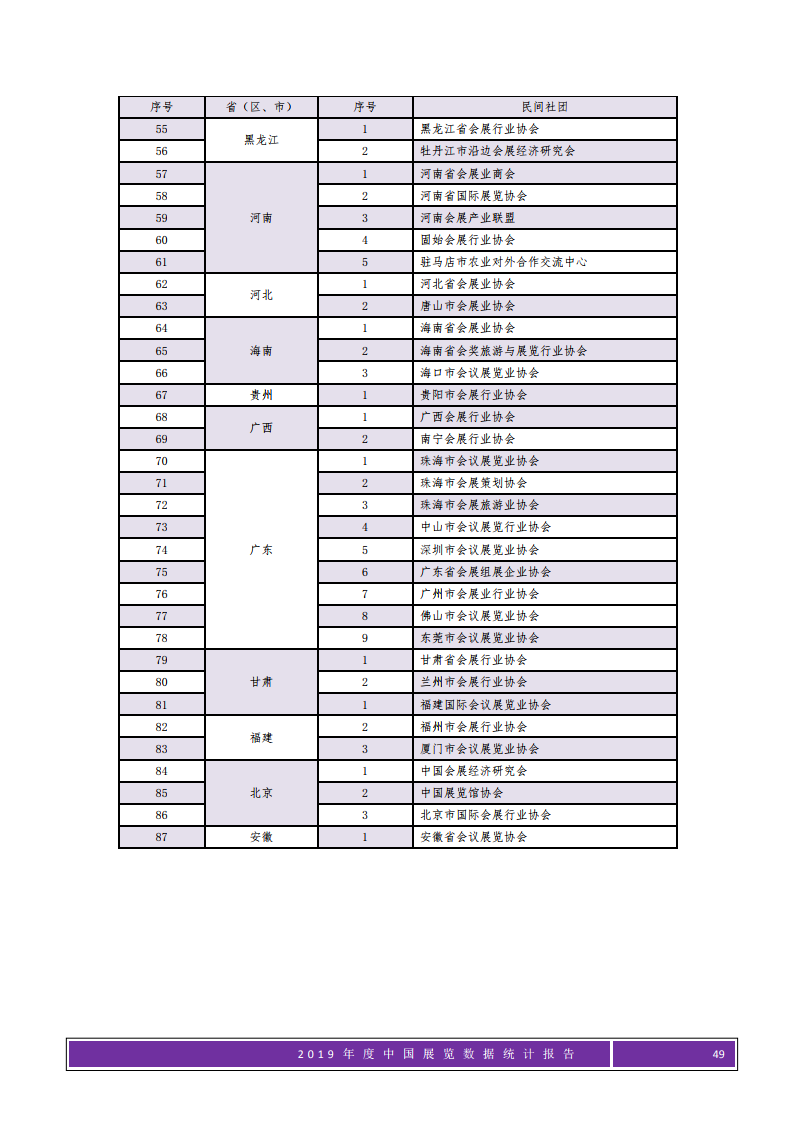
According to the report, the total number of exhibitions nationwide in 2019 was 11,033, with a total exhibition area of 14,877.38 million square meters, an increase of 0.6% and 2%, respectively, over 2018. The annual net increase of 65 exhibitions, the total exhibition area of 301.62 million square meters.
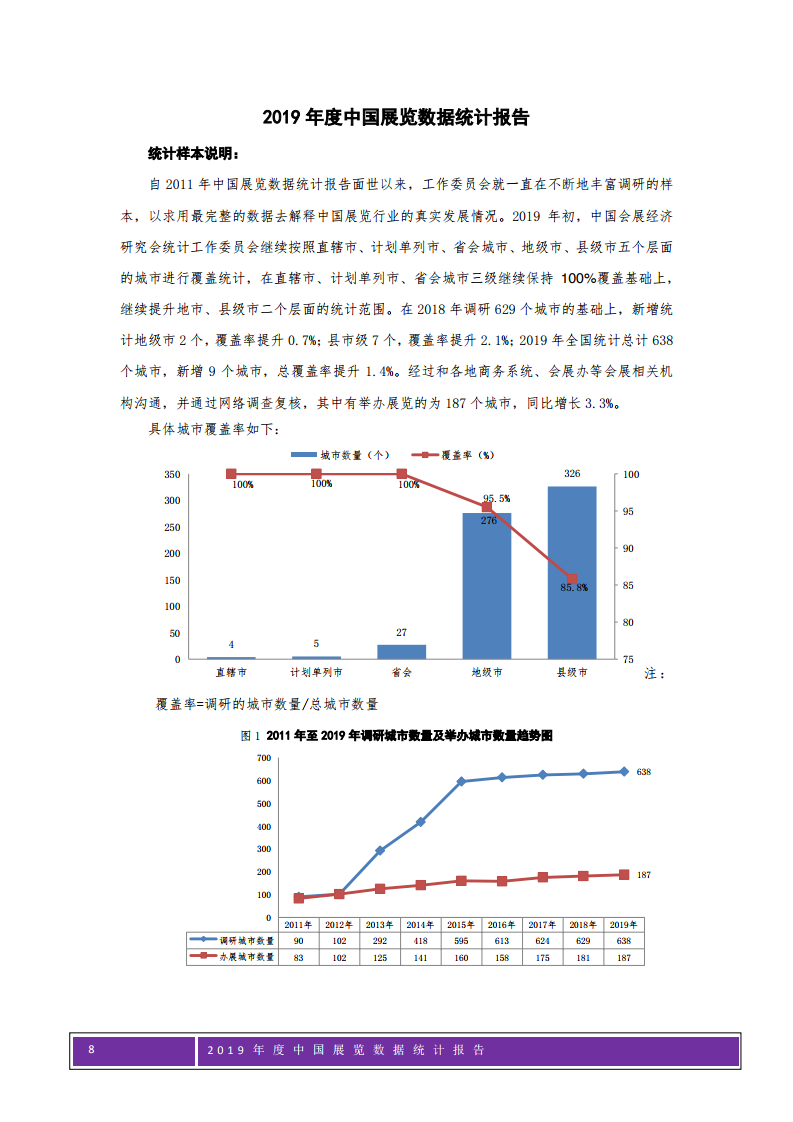
The number of exhibition cities included in the statistics in China has increased from an initial 83 to 187 in 2019, according to statistics on the exhibition industry carried out by the Congressional Exhibition Economic Research Institute in 2011. During this period, the total number of exhibitions increased from 7330 to 11,033 in 219, and the total exhibition area increased from 81.73 million square metres to 148.7738 million square metres in 2019. In 2011-219, the number of trade and economic exhibitions in China and the total area of exhibitions grew at an average annual rate of 5.61% and 9.11%.
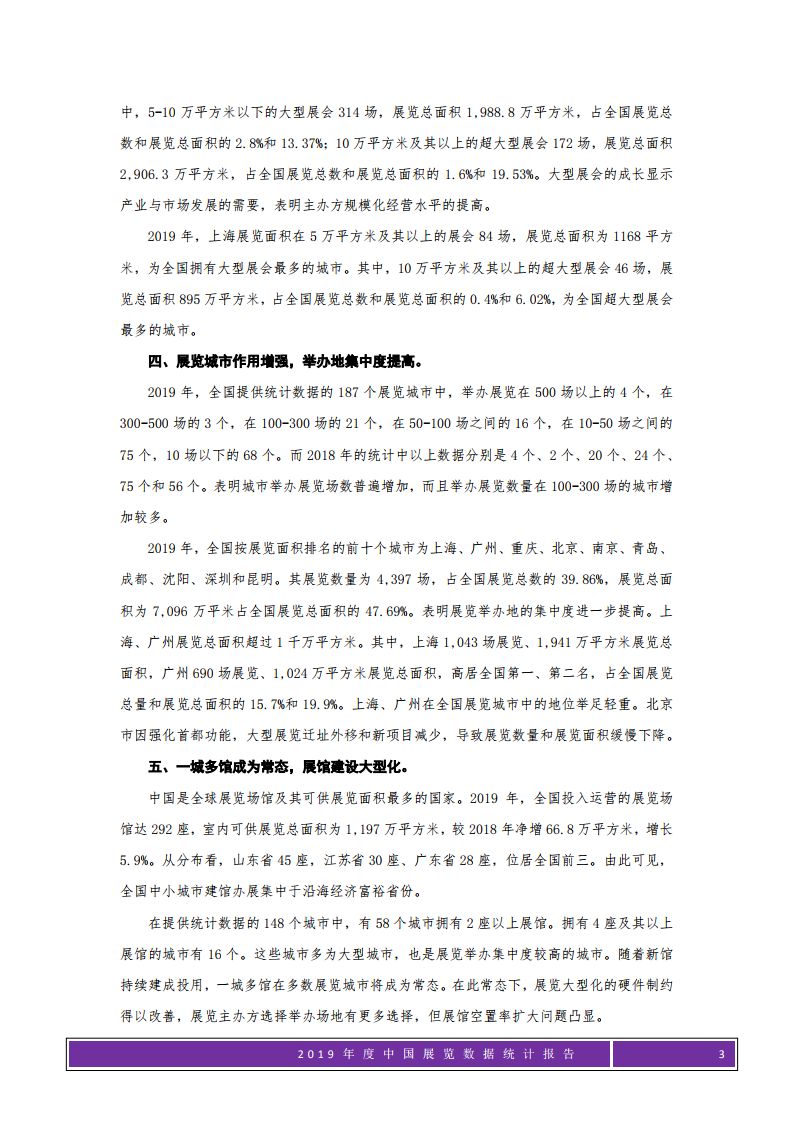
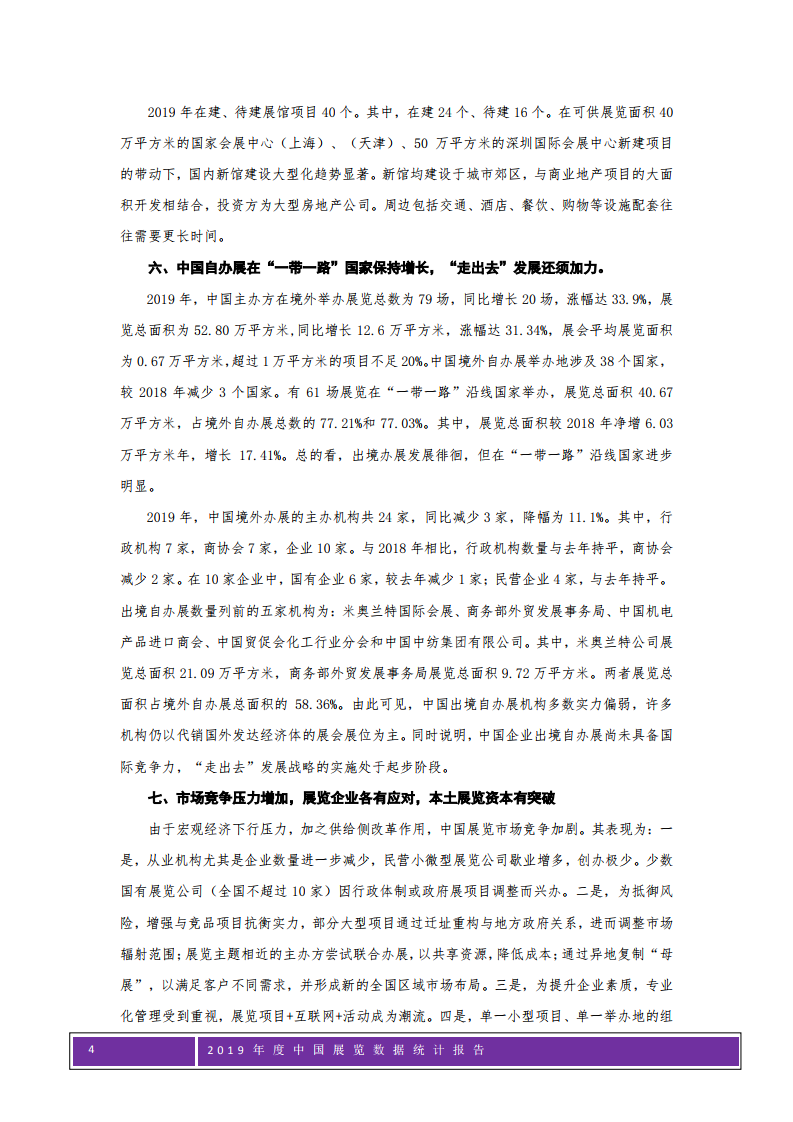
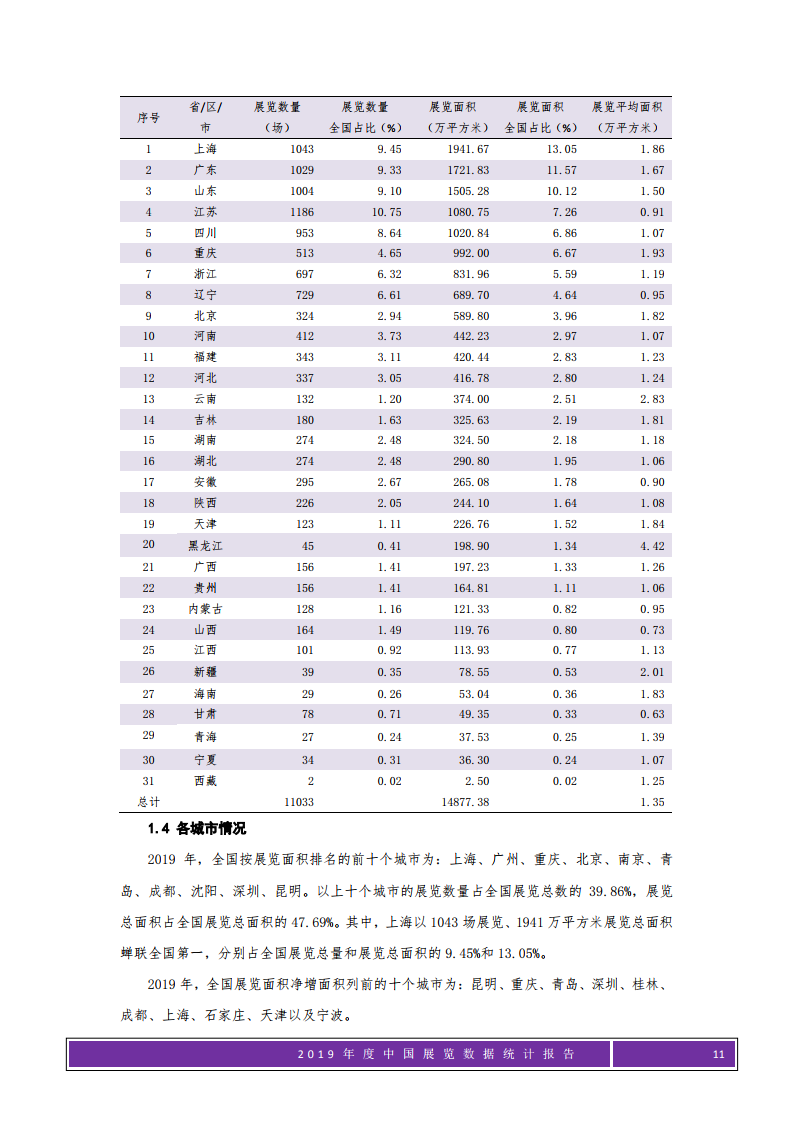
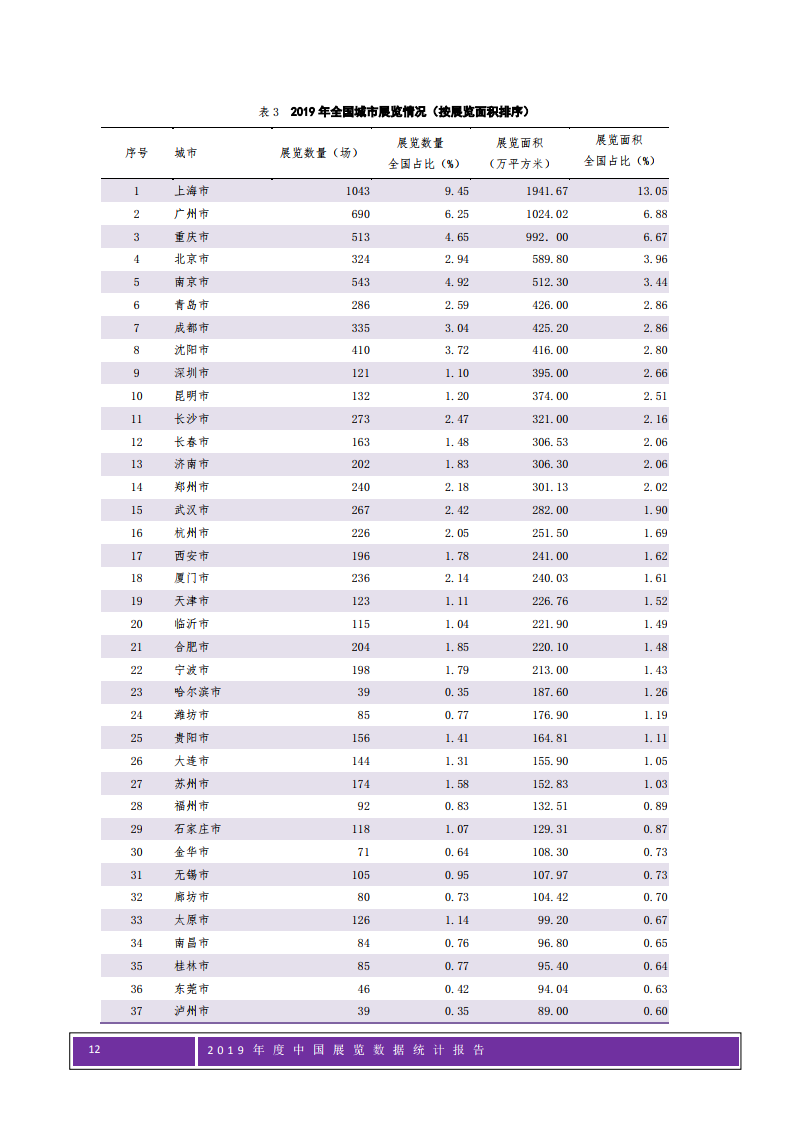
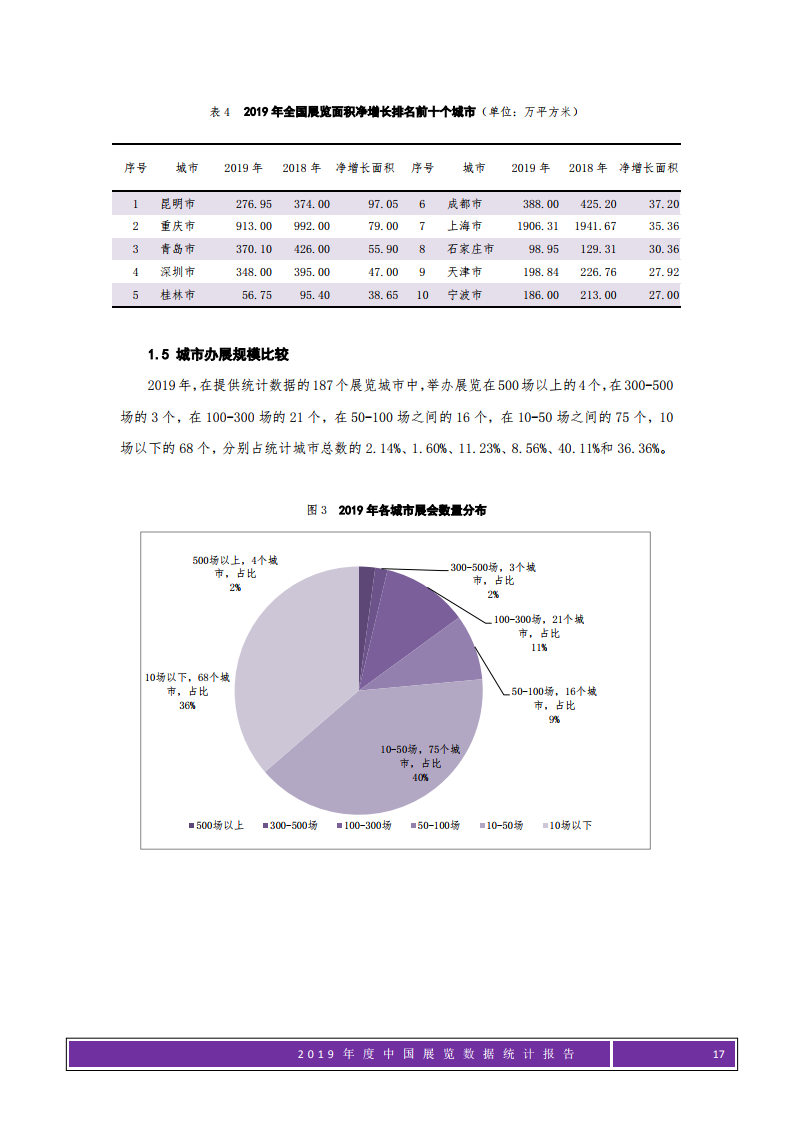
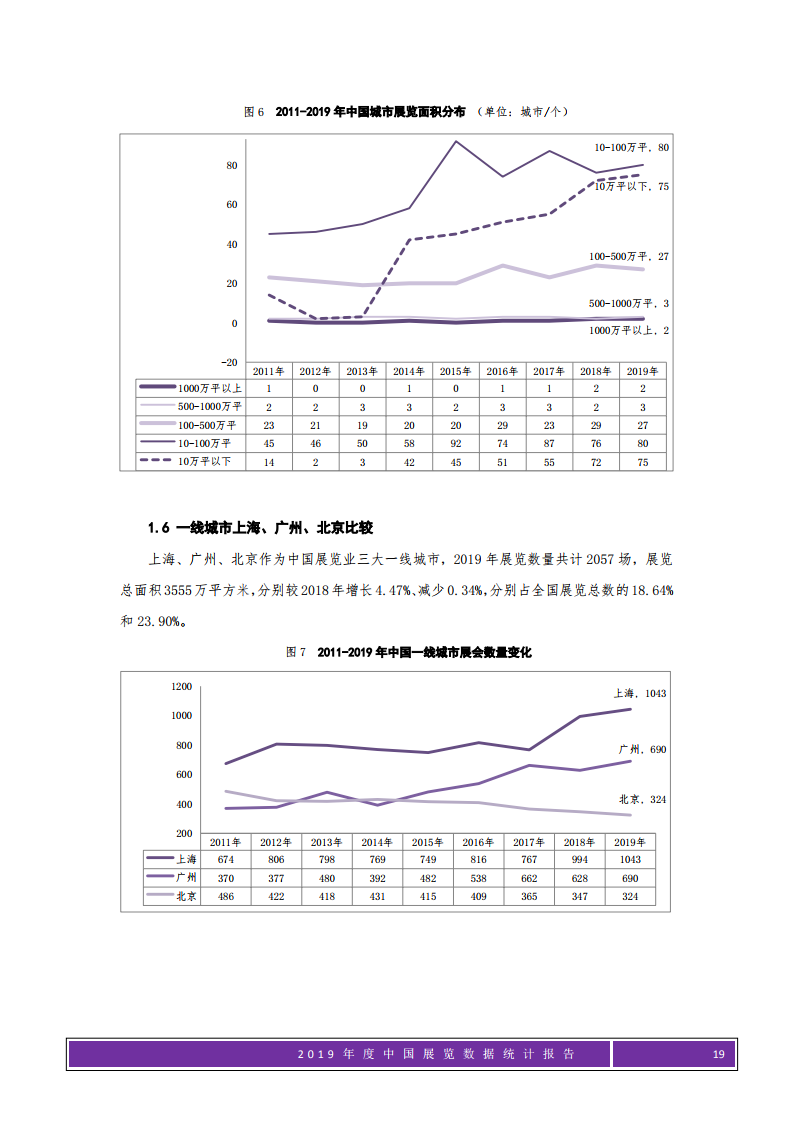
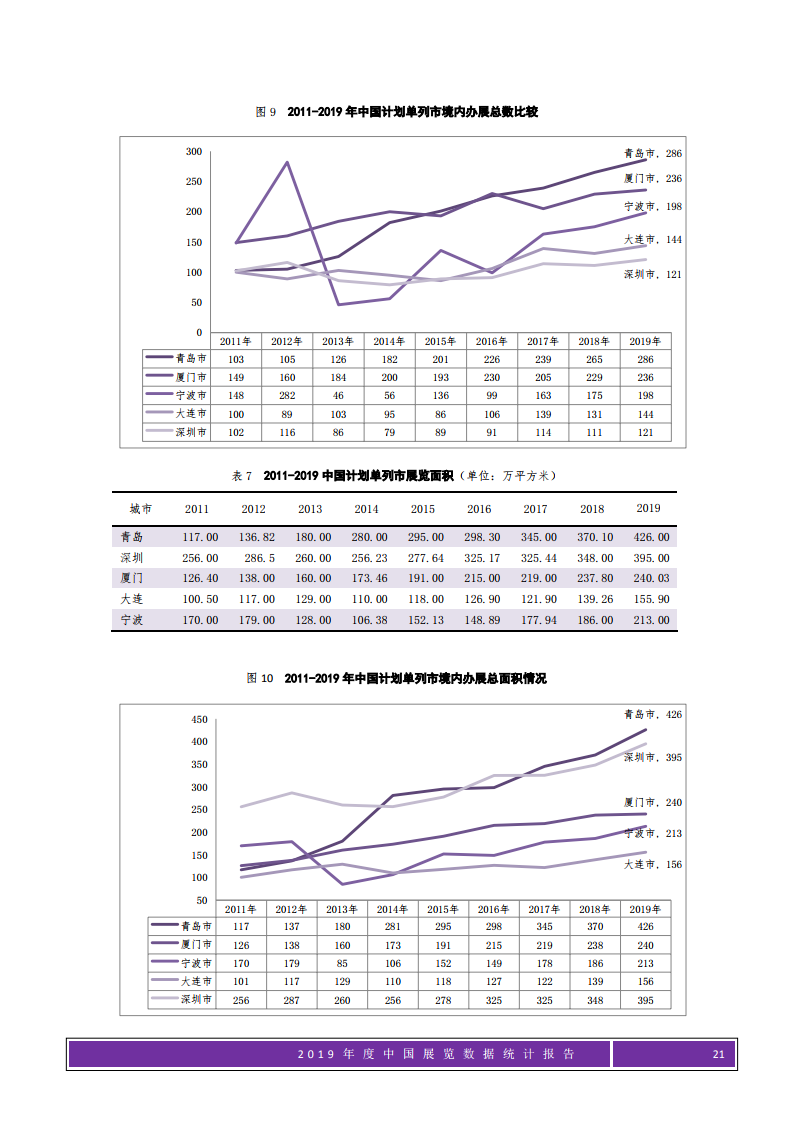
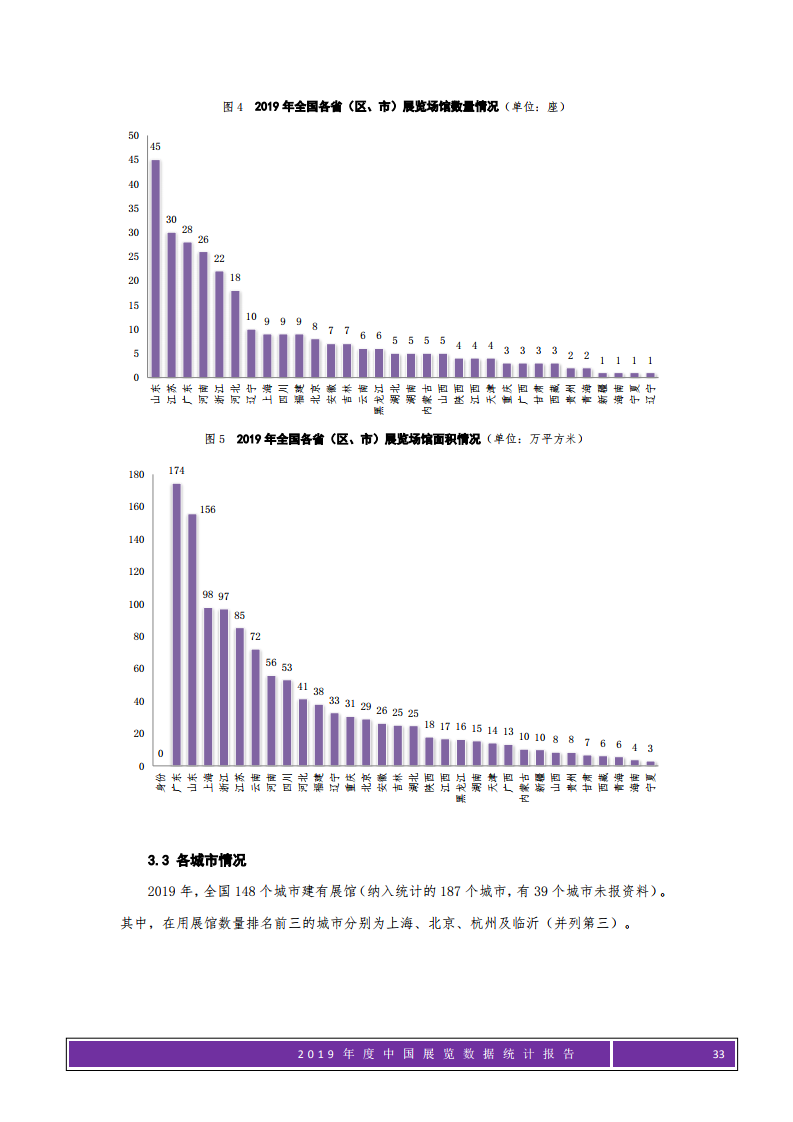
According to the Report, the top ten provinces (municipalities directly under the Central Government) ranked by exhibition area in 2019 are: Shanghai, Guangdong, Shandong, Jiangsu, Sichuan, Chongqing, Zhejiang, Liaoning, Beijing and Henan. The number of exhibitions in the above ten provinces (municipalities directly under the Central Government) accounts for 71.52% of the total number of exhibitions in the country, and the total exhibition area accounts for 72.69% of the total exhibition area in the country. Shanghai, Guangzhou and Beijing, as the three first-tier cities in China's exhibition industry, have a total of 2057 exhibitions in 2019, with a total exhibition area of 35.55 million square meters, an increase of 4.47 percent and a decrease of 0.34 percent over 2018, respectively, accounting for 18.64 percent and 23.90 percent of the total number of exhibitions in the country.
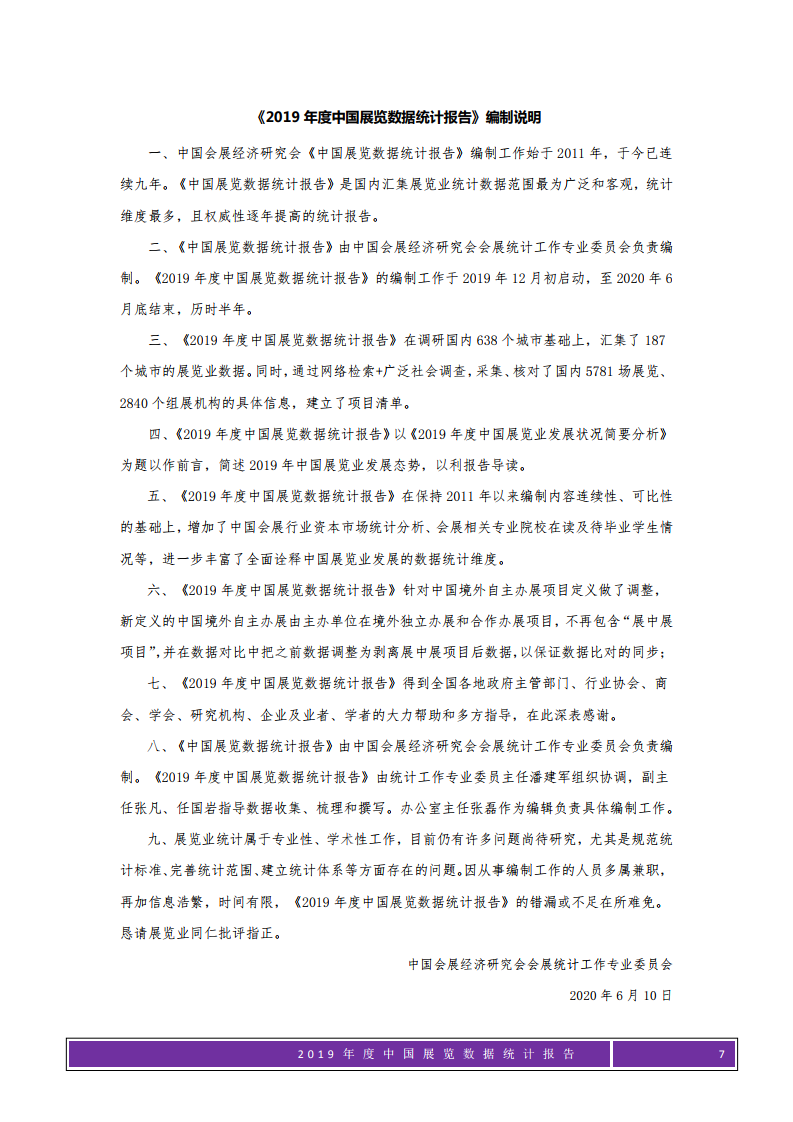
In order to improve the reliability of statistical data, on the basis of local reports of statistical data, the Office of the Statistical Commission of the China Convention and Exhibition Economic Research Association collected and checked the specific information of 5781 exhibitions nationwide through the Internet search and sampling inquiries, and established a list of projects.
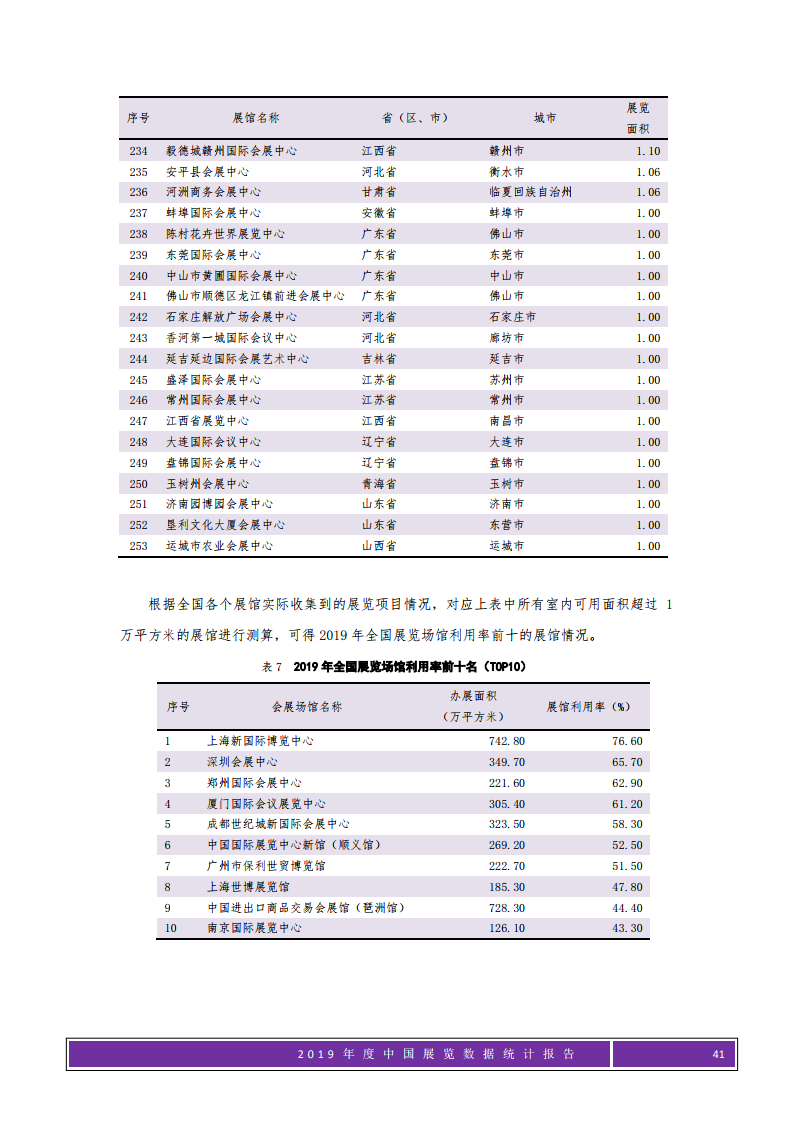
The 5781 exhibitions listed in the 2019 project list are classified into four categories by exhibition area by size. Of these, 2608 exhibitions of less than 10,000 square meters, accounting for 43.16% of the total number of exhibition projects, with a total exhibition area of 12.66 million square meters, accounting for 11.70% of the total area of exhibition projects. 171 exhibitions of 100,000 square meters and above, accounting for 2.96% of the total exhibition area of 29.69 million square meters, accounting for 25.85% of the total exhibition area.
Of the 5781 exhibitions on the 2019 list, 5,274 industry exhibitions, in addition to the 507 comprehensive exhibitions, can be divided into 27 industry sub-sectors by exhibition theme. In 2019, there were 507 comprehensive exhibitions with a total exhibition area of 9.402 million square meters, accounting for 8.77% and 8.19% of the total number of listed items, and 5274 exhibitions with a total area of 105.4636 million square meters, accounting for 91.23% and 91.81% of the total listed items.
In the industry, the largest number of passenger car-themed automotive exhibitions was 818, accounting for 15.51% of the total number of exhibitions in the industry, 43 fewer than in 2018, a decrease of 5%, with a total exhibition area of 16.71 million square meters, accounting for 15.84% of the total area of the industry exhibition, a decrease of 2.29 million square meters, or 12% compared to 2018. Secondly, building materials, cultural and religious.
In addition, the report shows that in 2019, 15 foreign-funded exhibition enterprises held a total of 186 exhibitions in China, accounting for 3.21% of the total number of national exhibitions collected, a decrease of 12.7% year-on-year in 2018. The total area of the exhibition was 11.8866 million square meters, a decrease of 1.007 million square meters, a decrease of 7.8%, accounting for 10.35% of the total area of the national exhibition collected. Of the 15 international exhibition enterprises in China, Infulman Exhibition Group has the largest number of exhibitions in China, with a total of 41 exhibitions, accounting for 22.05 percent of the total number of exhibitions held in China, and a total exhibition area of 300.19 million square meters, accounting for 25.52 percent of the total area of international exhibition enterprises.
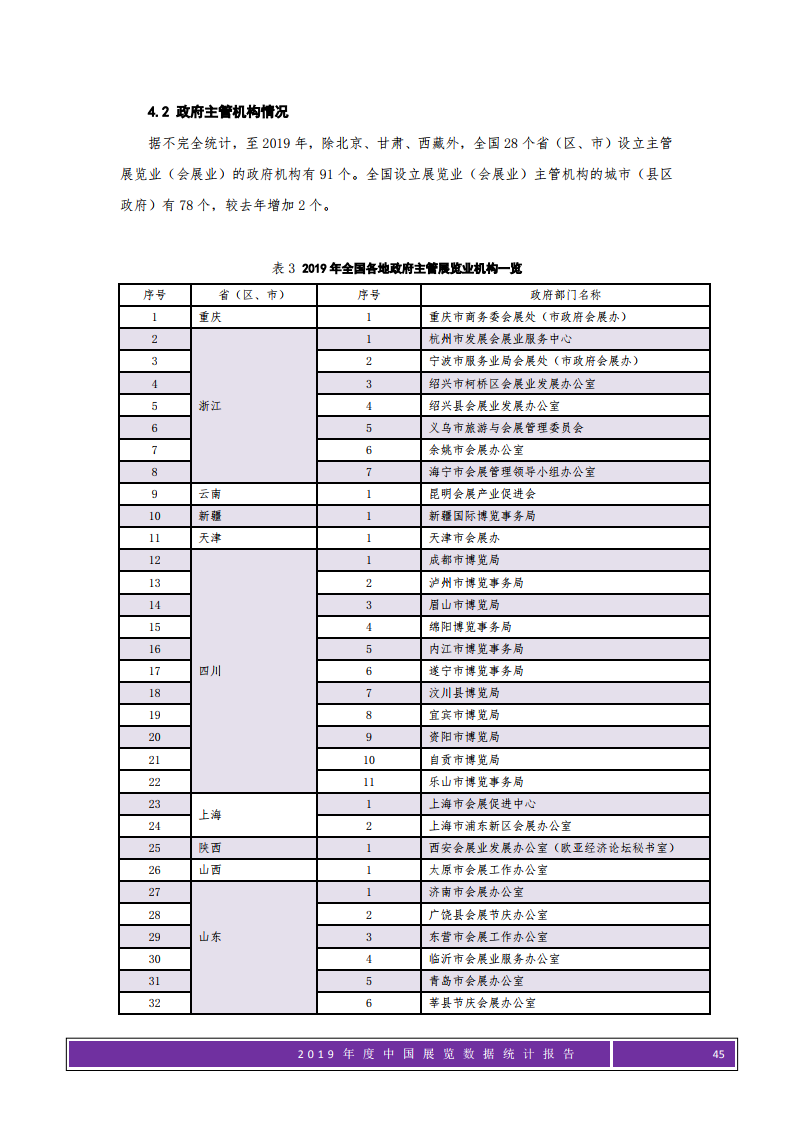
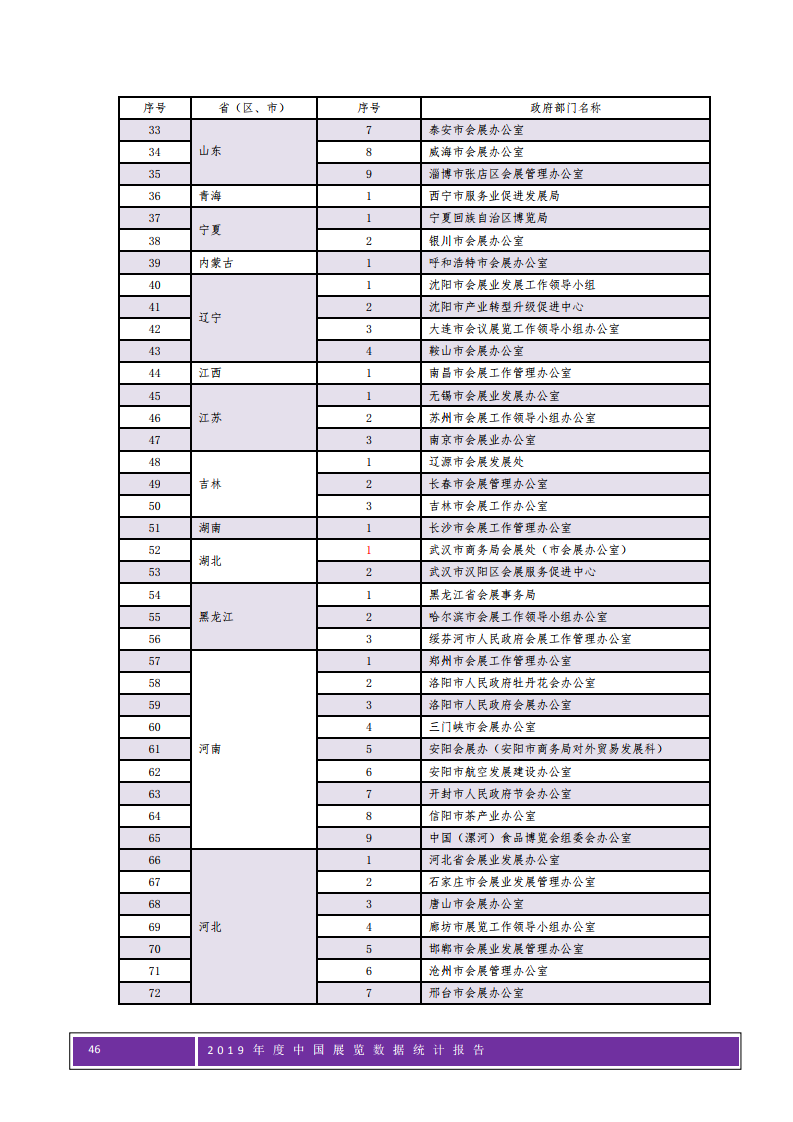
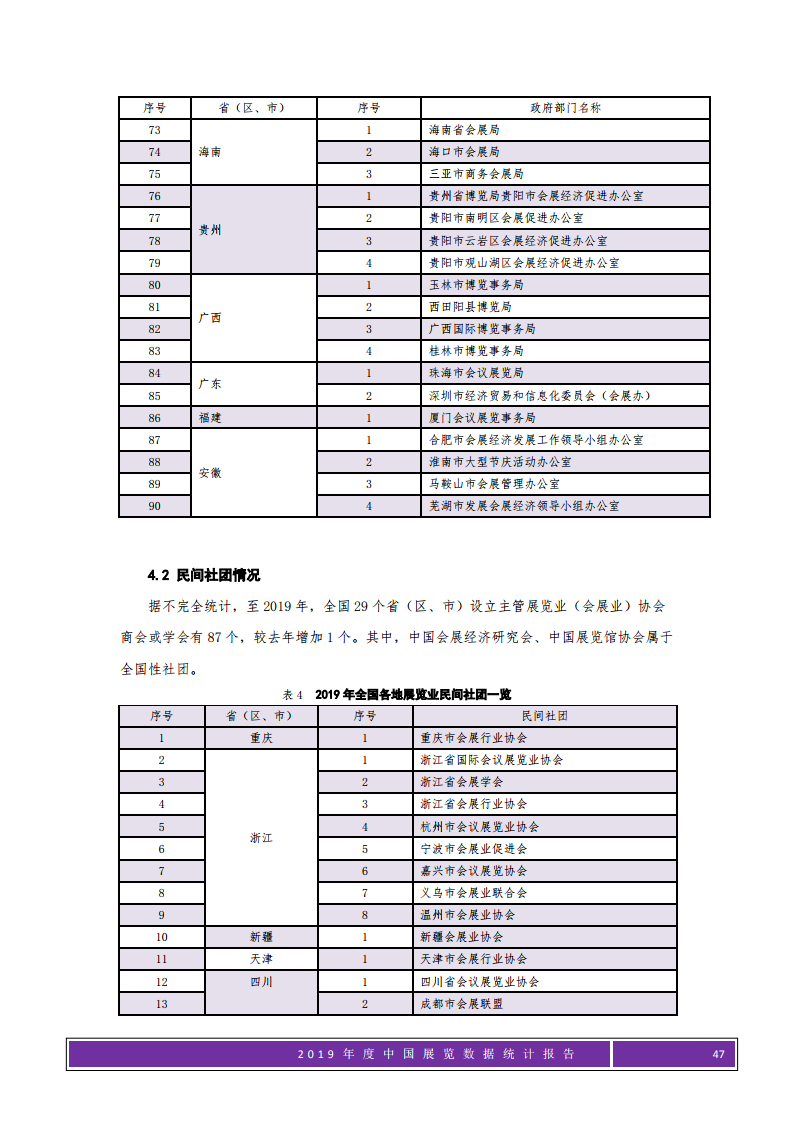
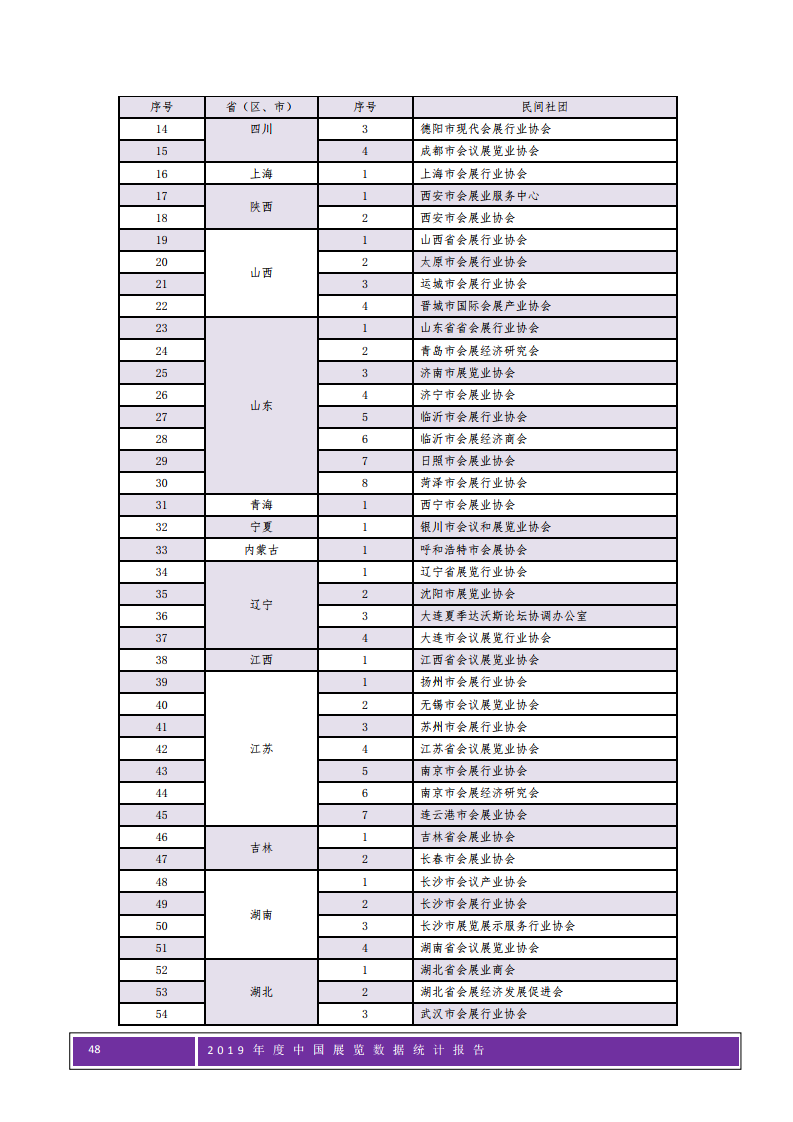
Pdf version will be shared to 199IT high-end communication group, thank you for your support!


Report: Relationship between marketing decision makers and marketing companies
The 2020 Earth Big Data Support Sustainable Development Goals report
Agile and Resilient: Alternative Investment Reports for New Realities
Impact on the World: A Report on the Composition of Children's Happiness in Rich Countries
First digital euro report: Digital currency project launched in 2021
China Shopping Center Development Report for the First Half of 2019-2020
The achievements and challenges of artificial intelligence in five major industries
Q1-Q2 China TMT Industry Private Equity and Venture Capital Report 2020
United Nations Network of Economists: A Trend Report That Shapes Our Time
Progress report on food and agriculture-related SDR indicators for 2020
China's balance of payments report for the first half of 2020
Report: Rethinking Japan's Retail Strategy in the COVID-19 Era
Cross-border e-commerce white paper: China's cross-border e-commerce sold to the world
China Home Appliance Market Report for the First Half of 2020
Culture: The most important thing for new fashion and luxury consumers
2020 Asia Pacific Travel Industry Consumer Behavior and Attitudes Research Report
2020 China accommodation market network word-of-mouth report
Google Decoding Decision Report: Decision Awareness in Chaos
SaaS merger and acquisition report for the second quarter of 2020
Successful experience in optimizing the business environment in China
2020 Annual Report of the CMO Expenditure Survey, Chief Marketing Officer
"14th Five-Year" a new starting point: China's highway enterprises to break the road
Research on Electric Vehicle Travel in Rural Areas of China (Version 2.0)
Report: Experiences and lessons learned from online brands and traditional retailers
Report: Changing global marketing procurement concepts and contributions
ASEAN Agricultural Food Science and Technology Investment Report 2020
2020 China Fashion Cross-Border E-commerce Development Report
Why restricting trade with China would end America's leadership in the chip industry?
Advertising procedural purchase supply chain transparency survey report
Covid-19 Impact on Advertising Spending 2020 Report: The Transformation of Television
United Nations Environment Programme: Plastic Limit Report (118 pages)
2020 Communications, Public Relations and Public Affairs Survey Report
China K12 Online Education Market Research and User Consumption Behavior Report
The impact of coronavirus on the data and marketing industry in 2020
Building shelf awareness: Quantify the impact of broadcasting on the FMCG brand at the last minute
2019 China Enterprise Digital Procurement Development Report
2020 Customer Journey Management and Customer Experience Measurement Report
Report: Chief Marketing Officer's Challenges and Standards for Good Marketers
Generation Z Asia Pacific: Interconnecting, Interacting, and Growing in the Asia Pacific Region
Report: Can Electric Vehicles Overcome the Coronavirus Crisis?
Report: The potential impact of COVID-19 on schools and education
The adoption and innovation of fintech in Hong Kong's banking industry
The cosmetics industry before and after the new crown epidemic is observed and prospected
Ai AI Chip Controversy Report: China's Challenge in the Technology War (69 pages)
Asia Pacific Investment Report for the first quarter of 2020
Mobile Advertising Index Report for the First Quarter of 2020
Report on effective transformation of energy systems in 2020
The fourth edition of the new crown pneumonia outbreak and global employment monitoring report
COVID - 19 Related Travel Restrictions: Global Travel Overview Report
2019-2020 Micro-Enterprise Financing Status Report (97 pages)

| NOTICE |
WeChat's public platform is currently available for subscriptionsNumber top function
Click on our home page
Check the top public number
Capture great content in a timely manner
For business cooperation, please contact Microsyscope: dingli Public Number Contribution Email: T@199it.com
Go to "Discovery" - "Take a look" browse "Friends are watching"